Join Our Telegram channel to stay up to date on breaking news coverage
BCH Price Prediction – August 31
The Bitcoin Cash slides below the moving averages as the broad-based selling activities hit the market.
BCH/USD Market
Key Levels:
Resistance levels: $300, $320, $340
Support levels: $255, $235, $215
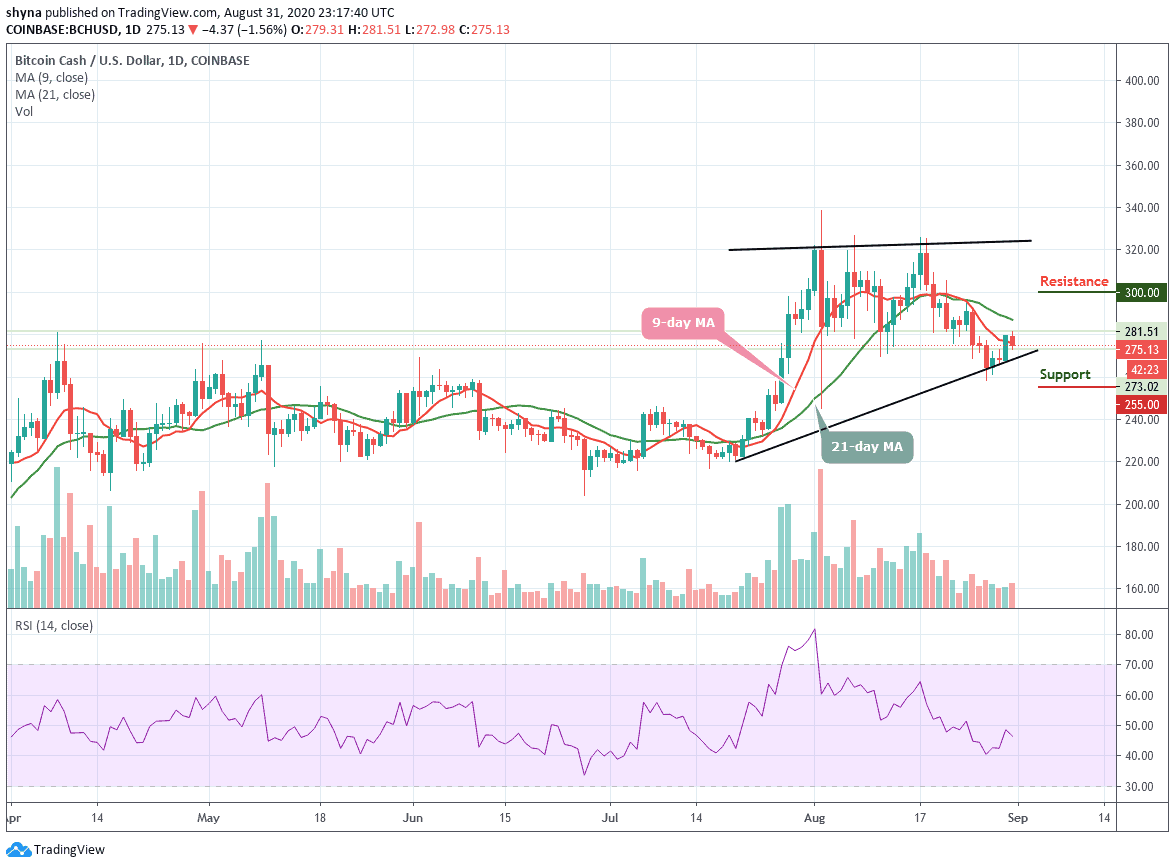
At the moment, BCH/USD is facing the south as its price settles around the $275.13 level. The daily chart reveals that the market price broke down today, touching its lowest daily level at $272.98. More so, the current performance of the coin is below the normal expectations of traders and the coin may continue to follow the downtrend if the market price remains below the 9-day and 21-day moving averages.
What is the Next for Bitcoin Cash?
If the BCH price fails to break the lower boundary of the channel, there is a risk for a fresh bearish wave. If the coin drops below the moving averages, initial support may be located at a $265 level where the market price could restart its decline.
However, RSI (14) reveals the sudden downtrend below 48-level, any further bearish movements could lead to the critical supports at $255, $235, and $215. Nevertheless, a high swing may take the bulls to a key above the moving averages. If this possible, the coin may trigger a bullish rally which could take the market price to $300, $320, and $340 resistance levels.
Against Bitcoin, the daily chart reveals that the sellers are currently showing strong commitment to BCH trading. Meanwhile, following the recent negative signs, the trend may continue to go down if the bears continue to put more pressure on the market.
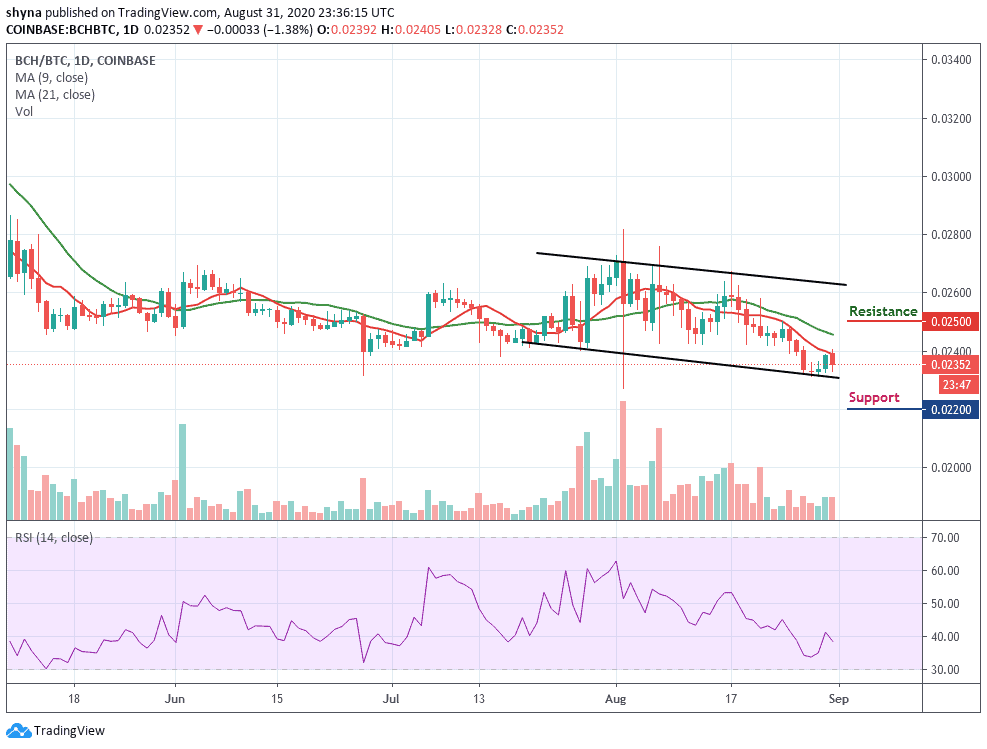
Moreover, as the RSI (14) moves below 40-level, if the buyers failed to hold the support of 0.0230 BTC, the market price may likely focus on the downtrend, pushing it below the lower boundary of the channel may bring it to the critical supports at 0.0220 BTC and 0.0210 BTC but a rebound could take the price above the moving averages to hit the resistance at 0.0250 BTC and 0.0260 BTC respectively.
Join Our Telegram channel to stay up to date on breaking news coverage