Join Our Telegram channel to stay up to date on breaking news coverage
XPTUSD Price Analysis – July 06
The Bears defended the supply level of $833 last week. Further increase in the Bears’ momentum may reduce the XPT price to $776 level.
XPT/USD Market
Key levels:
Supply levels: $833, $898, $962
Demand levels: $776, $714, $657
XPTUSD Long-term trend: Bearish
On the weekly chart, XPTUSD is bearish. XPT price was under the bulls control on June 24 and the price moved up to $833 level. The Bulls were unable to break up the supply level of $833 last two weeks due to the confluence at the level. Last week, a strong bearish candle formed which returned the price towards the previous low but yet to reach the mark.
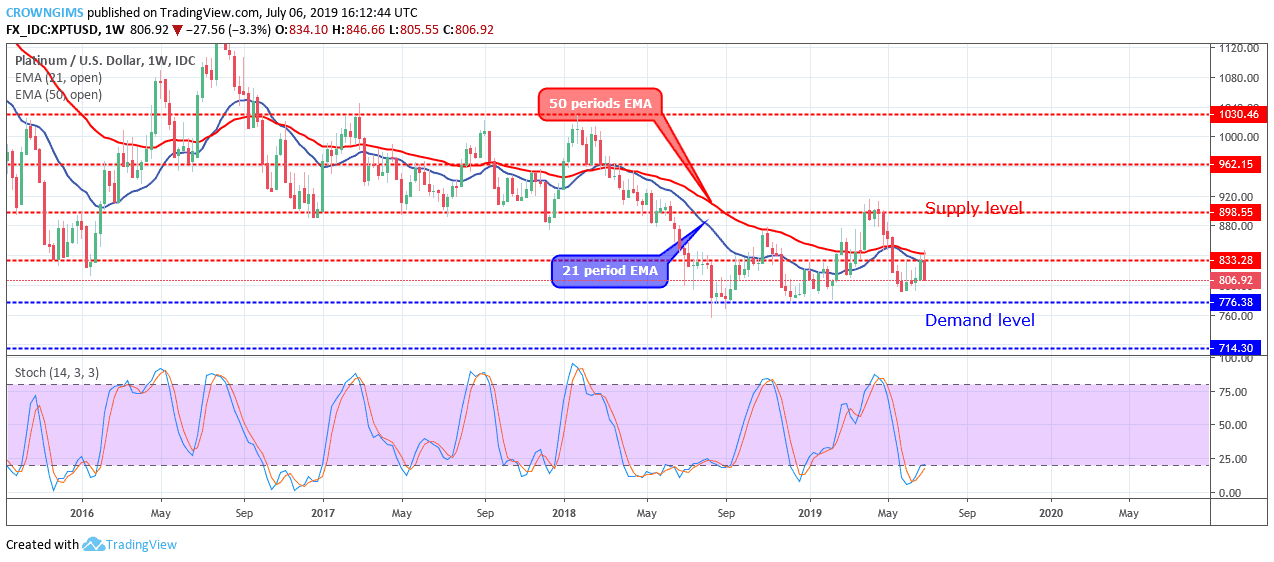
XPT price is trading below the 21 periods EMA and 50 periods EMA and the two EMAs are placed at $833 level. The stochastic Oscillator period 14 is at 20 levels (oversold level) with the signal line about pointing down to indicate a sell signal. The Bears defended the supply level of $833 last week. Further increase in the Bears’ momentum may reduce the XPT price to $776 level.
XPTUSD medium-term Trend: Bearish
XPTUSD is bearish in the medium-term outlook. Last week, the XPT price was initially bullish and the bullish pressure placed the price above the supply level of $833. On July 05, the Bears waved into the market and recover all the increase made by the Bulls with the formation of strong massive bearish daily candle.
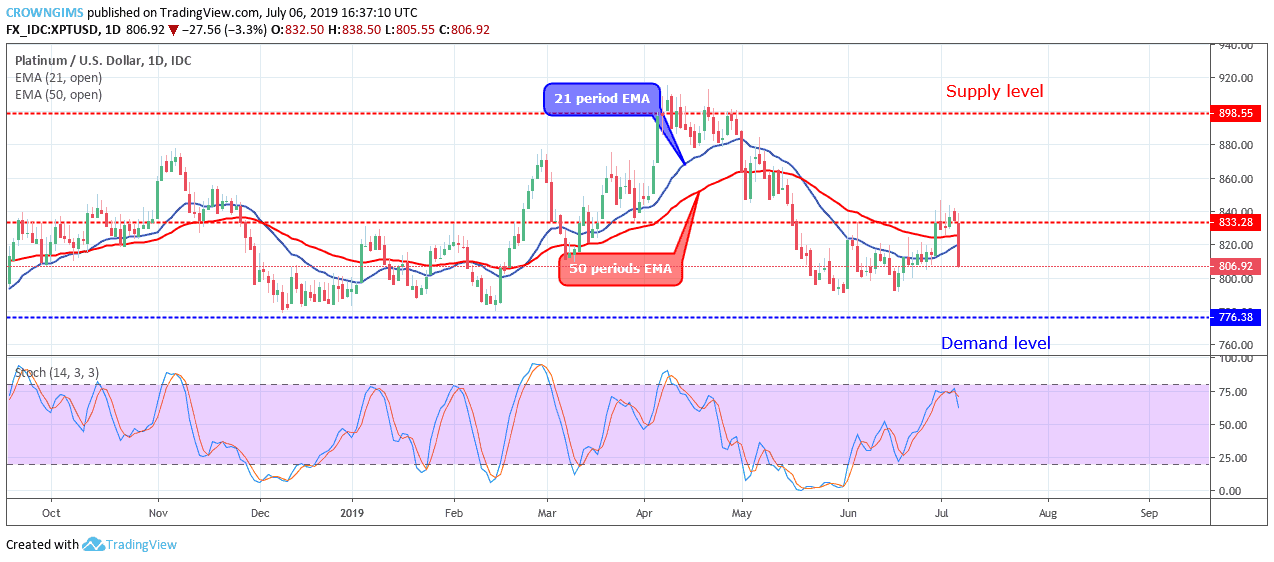
The Bears has returned XPT price below the 21 periods EMA and 50 periods EMA as a sign of bearish momentum. In addition, the stochastic Oscillator period 14 is at 75 levels with the signal lines pointing down to indicate a sell signal.
Please note: insidebitcoins.com is not a financial advisor. Do your own research before investing your funds in any financial asset or presented product or event. We are not responsible for your investing results.
Join Our Telegram channel to stay up to date on breaking news coverage