Join Our Telegram channel to stay up to date on breaking news coverage
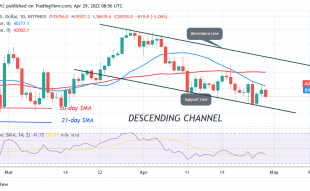
The Terra price prediction may extend the market movement below the $80 support if the price fails to hold within the channel.
LUNA/USD Market
Key Levels:
Resistance levels: $105, $110, $115
Support levels: $65, $60, $55
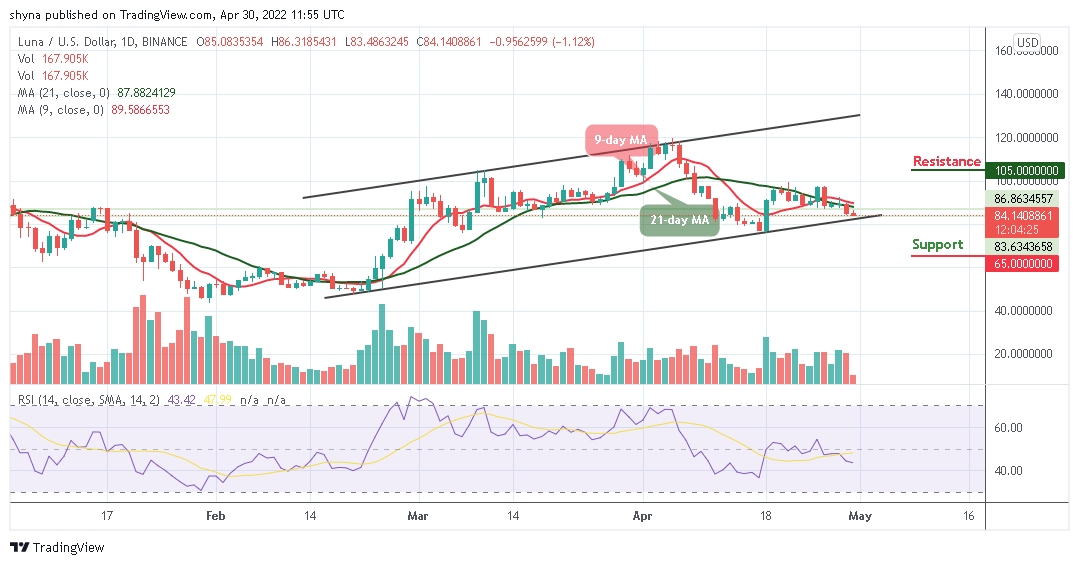
LUNA/USD is currently showing a downward movement as the coin has not been able to sustain a steady uptrend over the past few days. However, the Terra price has formed a pattern where the day could begin either with an up or downtrend, but the coin reverses towards the end of the day.
Terra Price Prediction: What to Expect from Terra (LUNA)
The Terra price may continue to consolidate itself in a flag formation, waiting for a cross below the lower boundary of the channel. However, the daily breakdown reveals that the LUNA price may drop to the support level of $80 before facing the upside. Meanwhile, if the support level of $80 gets weak, a price break-down may occur as the bears may find new lows at $65, $60, and $55 support levels.
On the contrary, a bullish movement may likely cross above the 9-day and 21-day moving averages and this could push the market price towards the $105, $110, and $115 resistance levels. For now, the Relative Strength Index (14) is moving above 40-level, and the market prepares for a new trend as the signal line may move sideways.
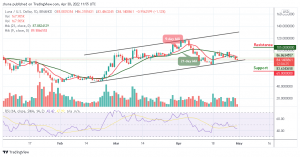
Compared with Bitcoin, Terra continues to perform very poorly due to a recurring bearish sentiment leading to a drastic drop in the market. However, when the LUNA price drops, sellers pose an additional threat to buyers, meanwhile, any breakout below the lower boundary of the channel may cause the coin to collapse.
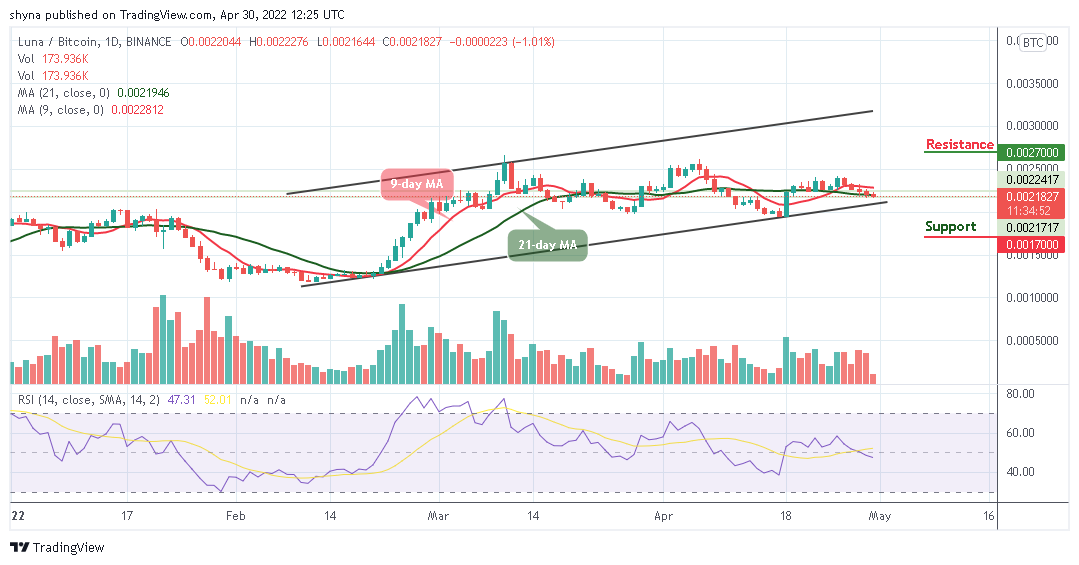
However, for a positive upsurge, 2700 SAT and above are the major resistance levels for the coin, but a bearish continuation below the channel could test the important support at 1700 SAT and below. More so, the trading volume is seen fading away as the Relative Strength Index (14) moves below 50-level, keeping the price on the negative side.
Join Our Telegram channel to stay up to date on breaking news coverage