Join Our Telegram channel to stay up to date on breaking news coverage
SHIB has been trading under the price level of $0.00001400 for a significant length of time. Till this point, SHIB/USD price action has respected the support level of $0.00001168 and the resistance of $0.00001325. Nevertheless, we may be at the point where that narrative will change for the worse. This is because price action seems trying to break down this once respected support level.
Shiba Inu’s Forecast Statistics Data:
SHIB current price: $0.00001168
SHIB’s market cap: $6.5 billion
Shiba Inu’s circulating supply: 549.1 billion
SHIB’s total supply: 589.74 billion
SHIB’s Coinmarketcap ranking: #14
Important Price Marks:
Upper Limits: $0.00001250, $0.00001300, $0.00001350
Lower Limits: $0.00001168, $0.00001138, $0.00001100
SHIB Pushing at a Strong Support, TAMA Remains Attractive
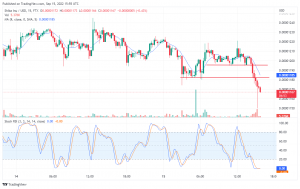
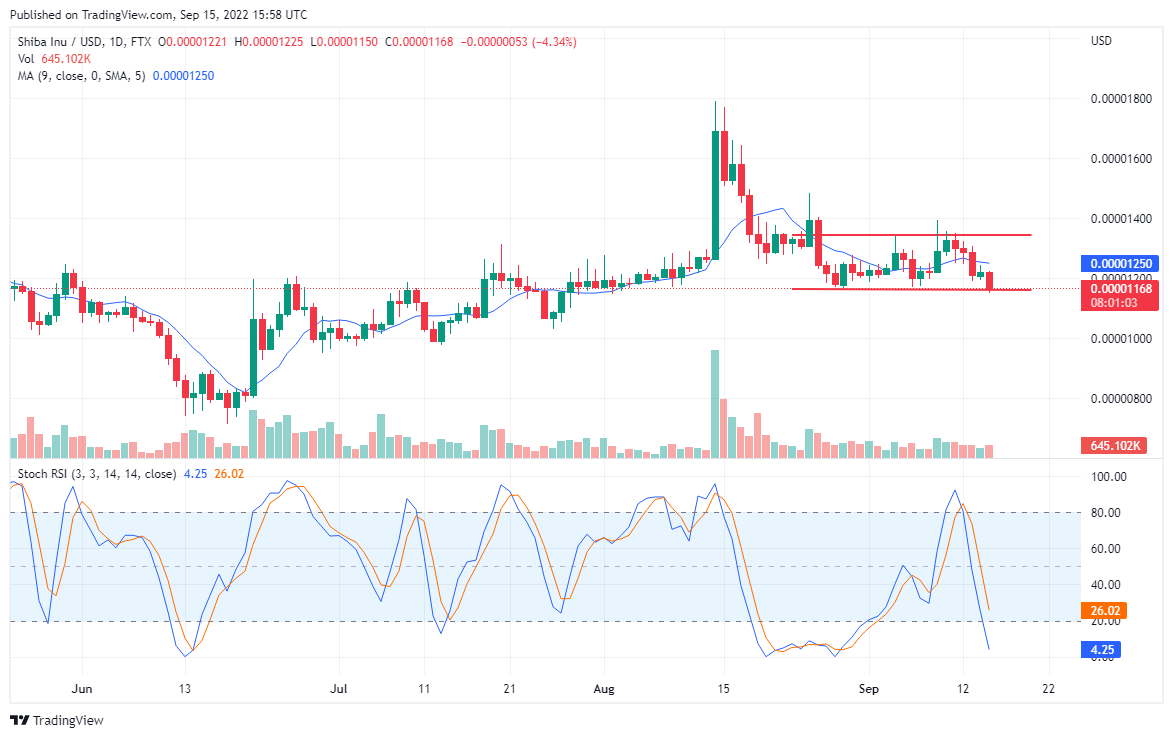
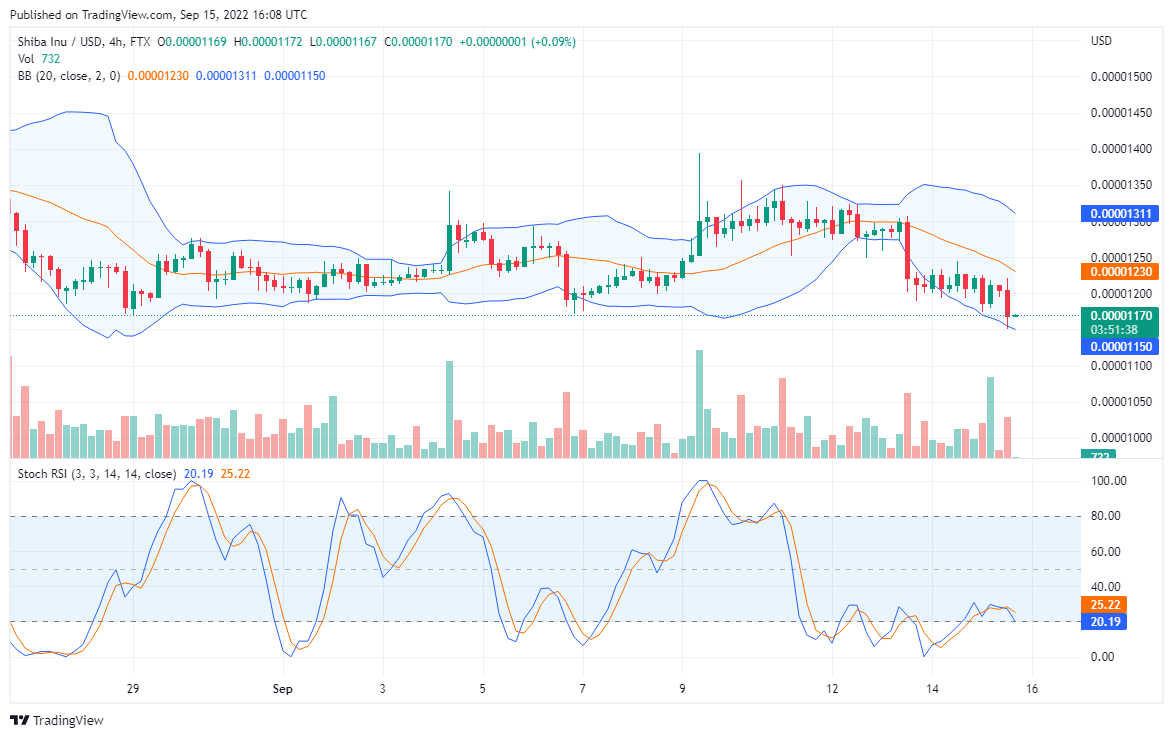
Strong support of $0.00001168 is about to be broken to the downside in the SHIB/USD market. The most recent candlestick on this chart formed with its closing price further lower than the MA line. Additionally, at this point, the current price of Shiba Inu in this market aligns with the strong support which has been untouched sometimes. Furthermore, the Stochastic RSI also points to an increasing downward trend. Consequently, it is almost sure that this price action will tear down this support, as the price may sink to near $0.00001050.
Shiba Inu’s Price Analysis: SHIB/USD Stays Consistent With the Downtrend
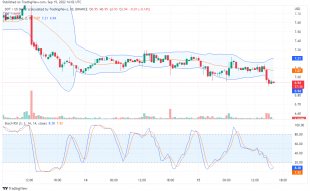
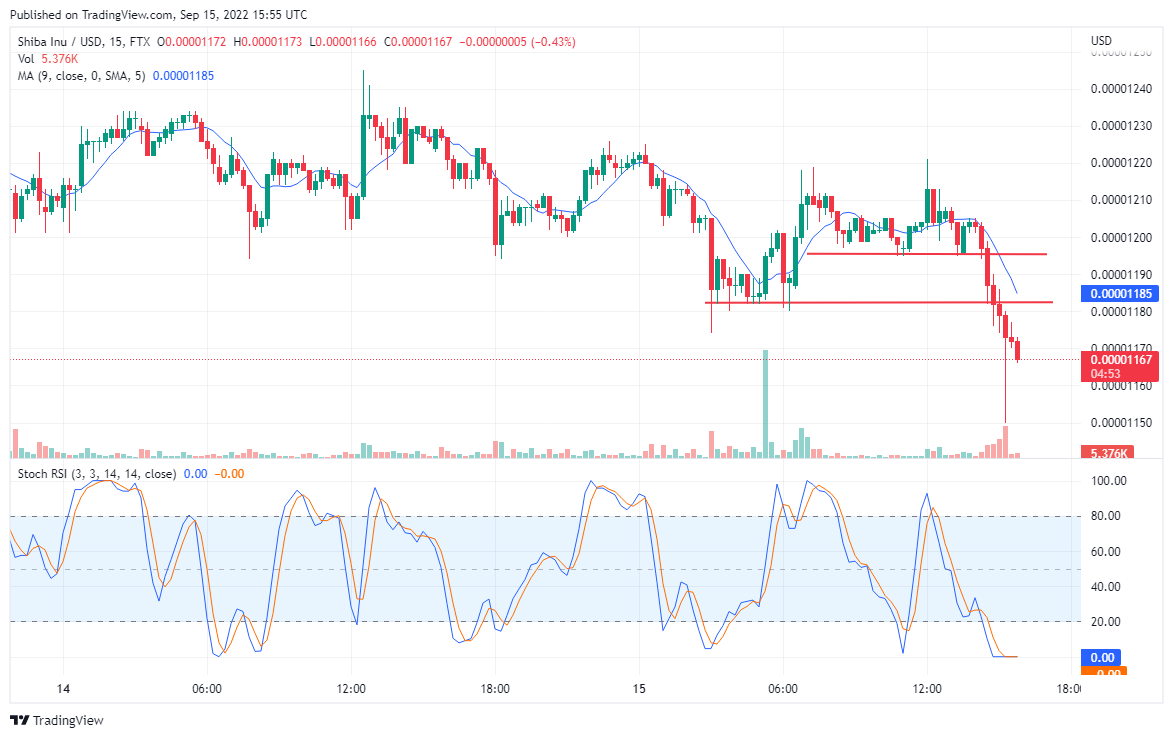
Even on shorter time frames, SHIB/USD price action appears to continue its move to the downside. The applied Bollinger indicator is oriented downwards, this indicates the general situation of this market. Also, the latest candle here shows that buyers and sellers are struggling seriously with each other. Consequently, this portrays the activity of the bears in this market.
Your capital is at risk
Furthermore, the RSI Lines look mangled while still very much below the overbought region. As a result, this portrays how strong sellers are as opposed to how weak buyers are. Eventually, this indicator points to a continuous downside retracement. Traders can either buy and hold to sell later when the price rises or, sell their holdings to prevent further loss. This is because the price may fall to $0.00001100 shortly.
Tamadoge completed the seventh phase of the presale over a month after it kicked off. The TAMA token was priced at 1 USDT = 40 TAMA during this seventh phase. After the $13.25 million milestone was achieved, the token’s price appreciated to 1 USDT = 36.36 TAMA, which is now the eighth phase. The eighth phase will be completed soon if the demand continues piling up at the rate it has done over the past month. The next phase will be the ninth and final phase. The price will also be higher during this phase as 1 USDT = 33.33 TAMA tokens.
Related
Join Our Telegram channel to stay up to date on breaking news coverage