Join Our Telegram channel to stay up to date on breaking news coverage
XRP Price Analysis – July 26
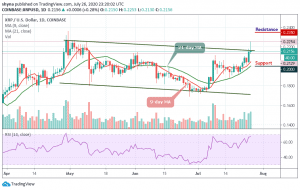
The Ripple (XRP) bulls hit resistance at $0.225, but the price may likely bounce back if the $0.200 could provide support.
XRP/USD Market
Key Levels:
Resistance levels: $0.235, $0.240, $0.245
Support levels: $0.200, $0.195, $0.190

XRP/USD follows a bullish wedge formation but now retreating to its lower limit. After falling from $0.225 today, the price of the XRP is now closer to the $0.212 support, which could offer a rebound level for the next bullish rally. For the past few days, the bearish impulse movement has been suspended. Should the bears exhaust momentum around the $0.210 support level, a bullish continuation is expected to occur.
Meanwhile, if the bears are out of breath around the support area mentioned, a bullish pursuit is expected. However, we should keep an eye on the $0.225 and $0.230 before printing a new high at the resistance levels of $0.235, $0.240, and $0.245. Nevertheless, the XRP bear may dictate the pace for the moment in the long term but remains to range on the short-term outlook.
More so, we should expect a quick buy once the trade reaches the wedge’s support at $0.205. And if the price fails to rebound, then a bearish breakout is likely to trigger more selling opportunity for traders, which might cause the price to retest the low at $0.200 and could further drop to $0.195, and $0.190 support levels respectively. The RSI (14) moves around 67-level. If the price oscillates downward, Ripple (XRP) may start falling.
When compares with Bitcoin, the Ripple market price is ranging and trading within the channel. For now, it is trading at 2169 SAT and expecting a break below the moving averages. Looking at the chart, both the bulls and the bears are struggling on who will dominate the market.
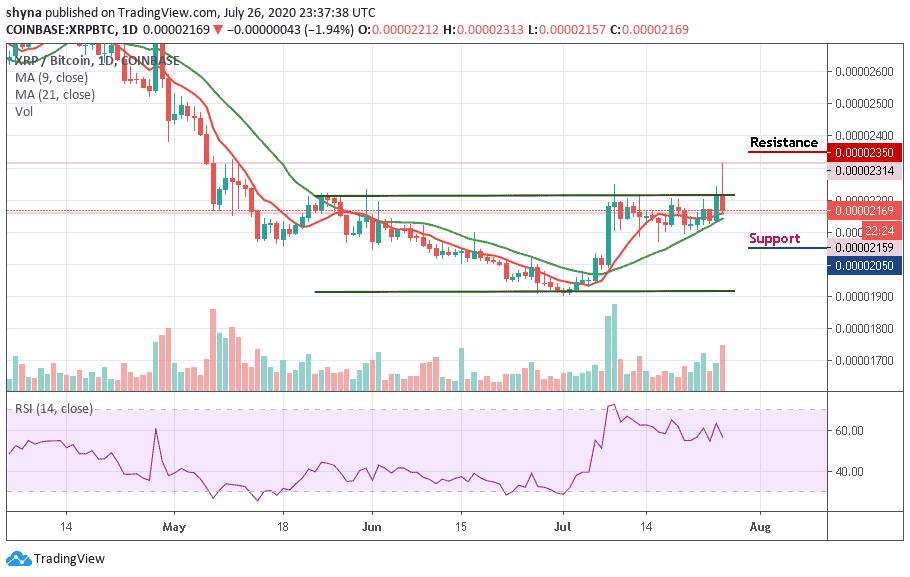
However, should the market fall below the moving averages, the next key supports could be 2050 SAT and below. Meanwhile, on the bullish side, a possible rise could take the coin to the resistance level of 2350 SAT and 2400 SAT. According to the RSI (14), the market may fall as much as the signal line moves below 55-level.
Join Our Telegram channel to stay up to date on breaking news coverage