
Join Our Telegram channel to stay up to date on breaking news coverage
Today’s REN/USD price analysis portrays quite a struggle between demand and supply, but the bulls are having the upper hand. However, between the 28th of September and to date, the market struggles at the $0.116705 resistance level. This might be an indication that the sellers are coming up and soon a trend reversal may ensue.
REN Market Price Statistic:
- /USD price now: $0.116940
- /USD market cap: $16,804,976
- /USD circulating supply: 99,037,500.36
- /USD total supply: 999,999,633
- /USD coin market ranking: #170
Key Levels
- Resistance: $0.1200000 $0.12500000 $0.13000000
- Support: $0.1100000 $0.10500000, $0.10000000
Your capital is at risk
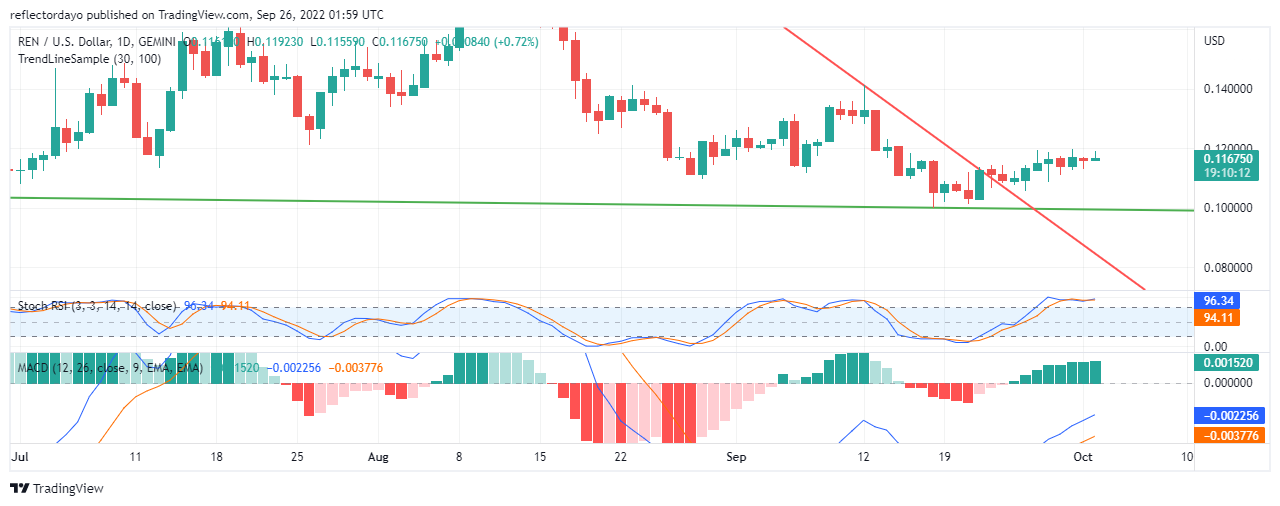
REN Market Price Analysis: The Indicators’ Point of View
From the chart analysis, we can draw two conclusions. Firstly, we can say the price is entering a consolidation period. Secondly, we can say that there is an imminent price reversal by the corner. This is because there is a very tiny bearish divergence between the price actions and the Relative Strength Index lines. In the MACD, the flat top histograms for the three recent days support the sentiment that the market is going into a consolidation period. Also, the two lines of the MACD are retracing upward position from the negative zone of the indicator.
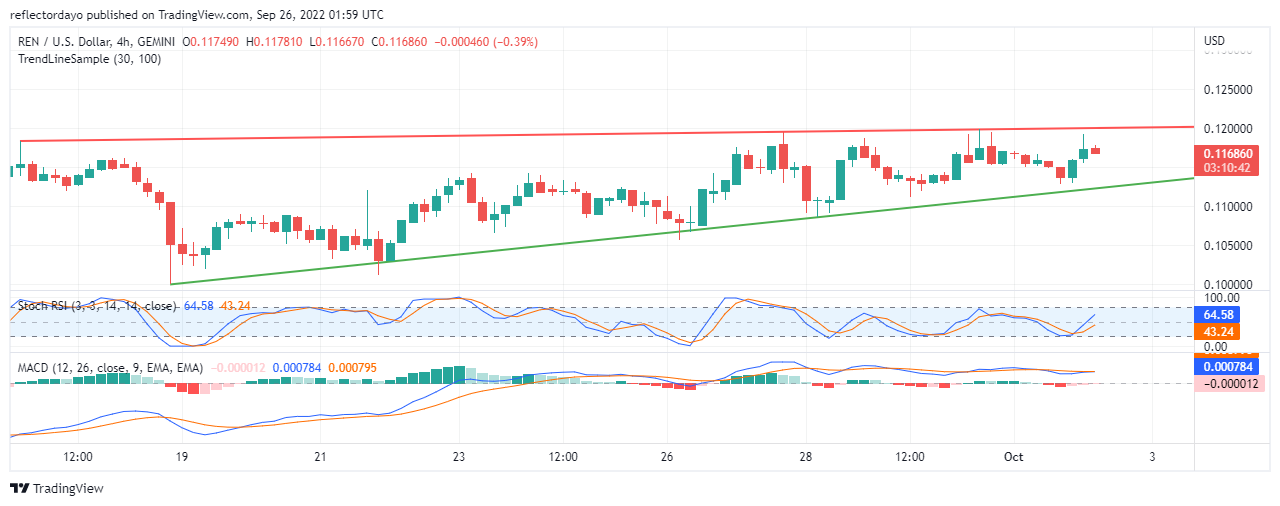
REN/USD 4-Hour Chart Outlook
In this analysis, the trendlines form an ascending wedge triangle. Usually, such type of triangle pattern means the trend may reverse soon. However, the other two indicators have something different to say. The stochastic RSI gives the impression that the market still has room for more bullish performance. In fact, according to the indicator, the market is in a bullish trend. The MACD also has the same sentiment.
Join Our Telegram channel to stay up to date on breaking news coverage