Join Our Telegram channel to stay up to date on breaking news coverage
LTC Price Prediction – August 29
LTC/USD could embrace consolidation in the near term especially if the technical indicator holds above the midline.
LTC/USD Market
Key Levels:
Resistance levels: $65, $67, $69
Support levels: $50, $48, $46
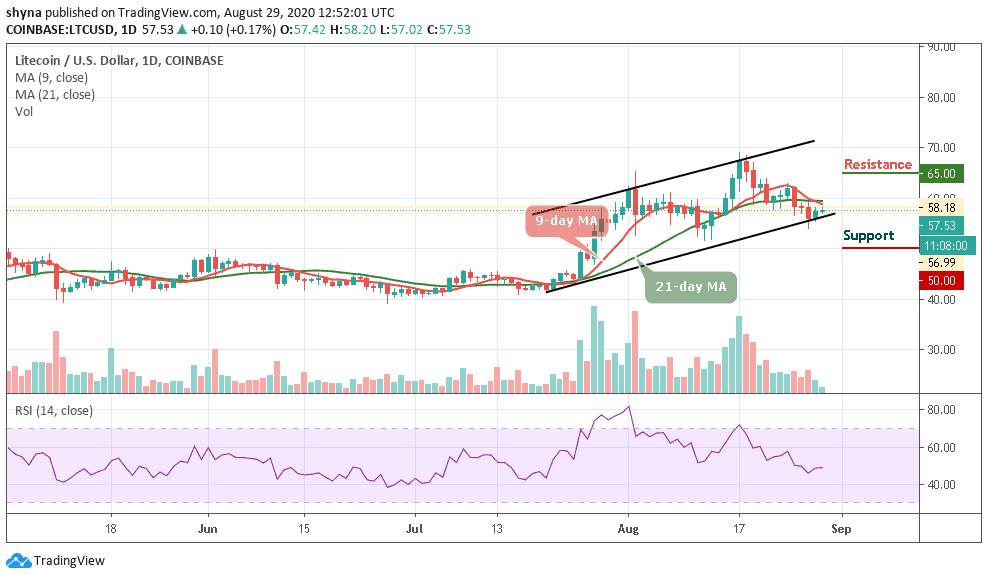
The daily chart shows that LTC/USD is actually running a little retracement move towards $58 with a slight gain of 0.17%. Despite today’s gain, Litecoin (LTC) is still trading below the 9-day and 21-day moving averages within the ascending channel. Traders can expect the price to continue to rise as soon as the bulls put more pressure on the market.
What is the Next for Litecoin?
Looking at the daily chart, if the 9-day MA cross below the 21-day MA and the price breaks below the lower boundary of the channel, LTC/USD may slide to the nearest support of $52 before getting to the critical supports at $50, $48, and $46 levels. In other words, if the market price follows the upward movement, traders can then expect a bullish continuation which could lead the market price to the resistance levels of $65, $67, and $69.
Meanwhile, according to the technical indicator, the RSI (14) is seen moving in the same direction around 49-level, therefore, if the market movement continues this way, LTC/USD may follow a sideways movement before focusing on the next direction.
Against Bitcoin, LTC continues to trend below the moving averages. In case of a trend reversal, there is a need for an increasing volume and resistance to cause an upsurge in the market. Now, the coin is trading around the 5020 SAT, traders can expect close support at the 4600 SAT and below.
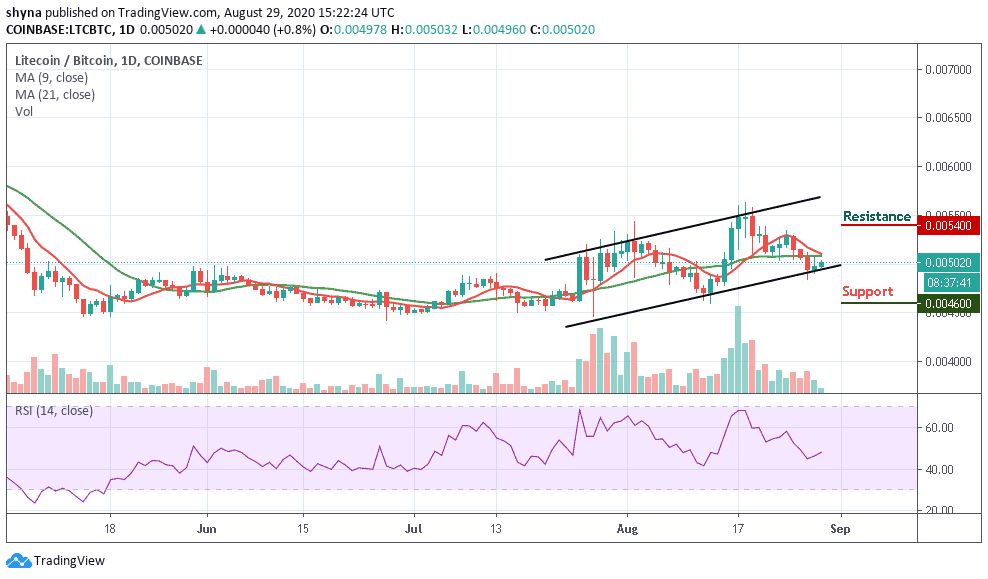
Presently, there’s a sign of a bullish movement in the market. If a bullish movement continues and validates a break above the 9-day and 21-day moving averages to hit the nearest resistance at 5200 SAT; we can then confirm a bull-run for the pair. Meanwhile, the closest resistance lies at 5400 SAT and above as the RSI (14) moves above 45-level.
Join Our Telegram channel to stay up to date on breaking news coverage