Join Our Telegram channel to stay up to date on breaking news coverage
LTC Price Prediction – September 24
The Litecoin price is currently changing hands at $44.74, trading under the moving averages.
LTC/USD Market
Key Levels:
Resistance levels: $52, $54, $56
Support levels: $35, $33, $31
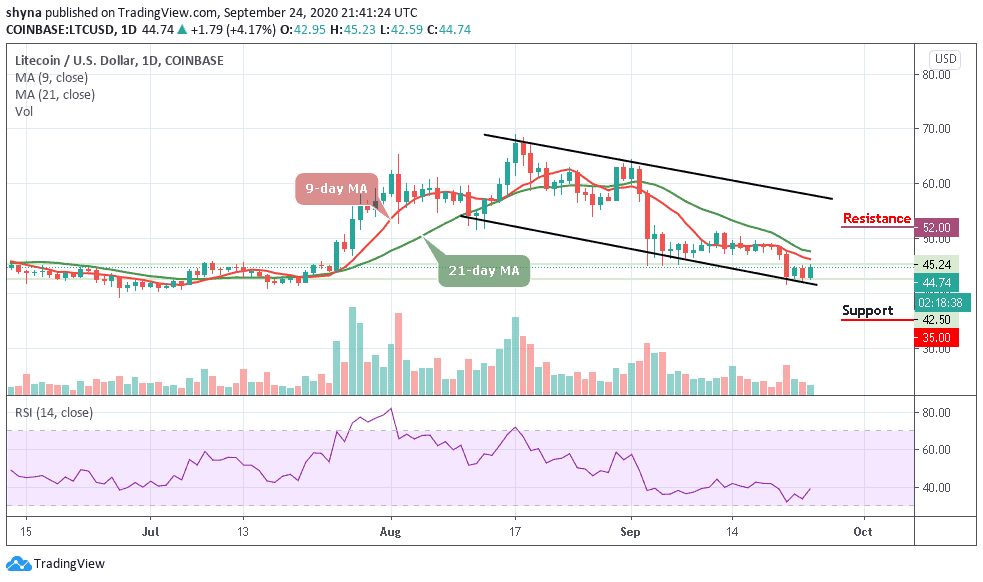
LTC/USD is currently trading at around $46 as it manages to surpass the current resistance of $47.85, the next target is at $48 where it touched a few days ago. More so, a breach from here may send the price straight to around $52 as the last 48-hours surge is supported at $44 support level. Therefore, if this level fails to hold strong, the price could slip back below the 9-day and 21-day moving averages at $43.
What is the Next Direction for Litecoin?
Looking at the current market sentiment, the bulls are now coming back into the market. Moreover, if the bulls can put more effort and push the market above the 9-day and 21-day moving averages, then the market price may likely hit the resistance levels of $52, $54, and $56 respectively. More so, any bullish movement above these key resistance levels should, therefore, encourage further buying.
In other words, a break below the lower boundary of the channel may provoke an even deeper decline towards the $35, $33, and $31 support levels. Meanwhile, looking at the technical indicator RSI (14), Litecoin may exhibit the tendencies to follow an upward trend as the coin moves towards the 40-level which may cause the market to remain stable around the average.
Against Bitcoin, LTC is still following the downward movement, as the coin continues to explode under the moving averages while trading at 4200 SAT after touching the daily high at 4263 SAT. The critical support level is located below the channel at 3800 SAT and below.
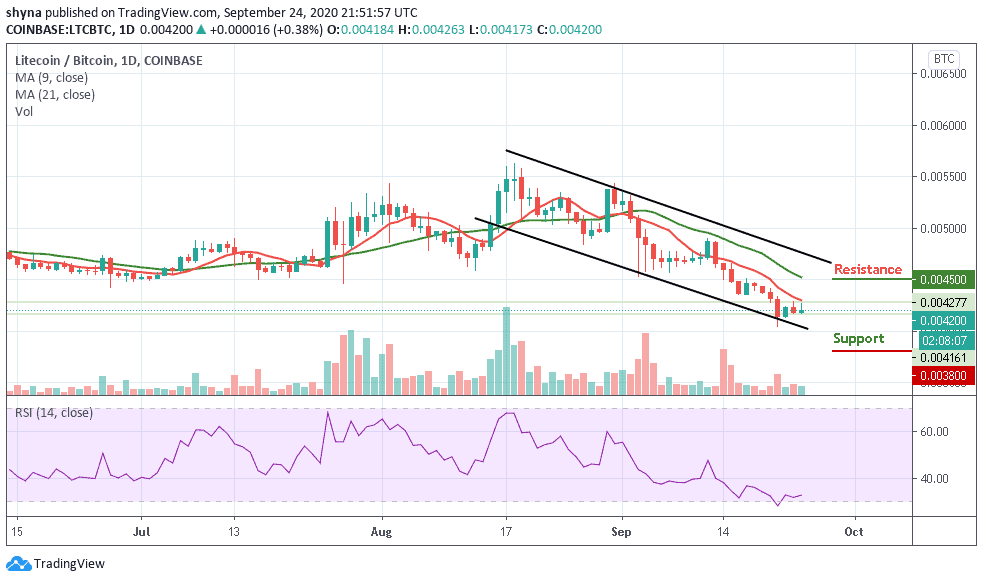
However, any attempt by the bulls to re-power the market, the coin may likely cross above the moving averages to reach the resistance level at 4500 SAT and above. Meanwhile, the price of Litecoin is currently following a downward movement as the RSI (14) moves below 40-level, suggesting more bearish signals.
Join Our Telegram channel to stay up to date on breaking news coverage