Join Our Telegram channel to stay up to date on breaking news coverage
LTC Price Prediction – February 29
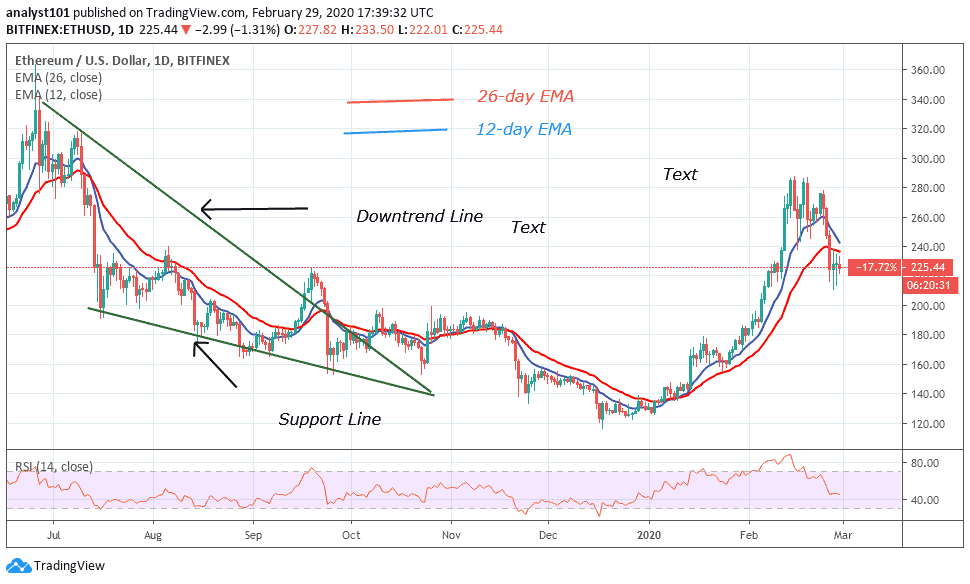
Litecoin (LTC) is still battling with the downtrend as the market price moves below the $60 support level.
LTC/USD Market
Key Levels:
Resistance levels: $70, $75, $80
Support levels: $48, $46, $44
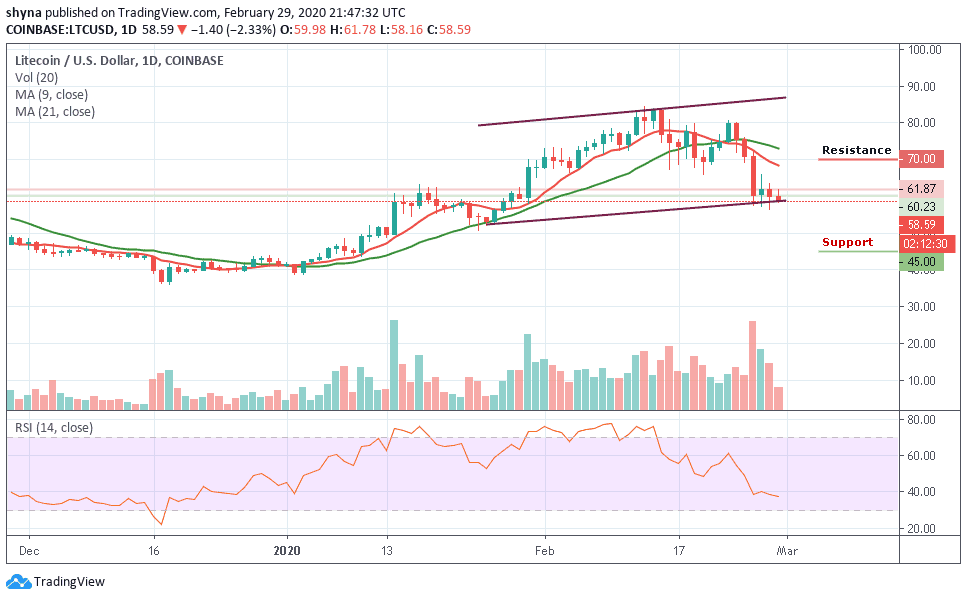
At the time of writing, LTC/USD has been trading down around 2.33% at its current price of $58.59; the coin is down slightly from its 24-hour high of $61.87. In addition, while zooming out and looking at Litecoin’s price action for the past few day’s trading periods, it is clear of how much volatility it has been incurring, as it is now, the price is trading below the 9-day and 21-day moving averages and about to break through the lower boundary of the channel.
From above, the nearest level of resistance lies at the $62 level. Above this, higher resistance lies at $65. If the buyers can climb above the $68 resistance, then further resistance may be found at $70, $75, and $80. In other words, the nearest levels of support are found at $55, below this; further support lies at $50 and 46.
In addition, if the sellers continue to push the price beneath the support level of $46, then, the $45, $40 and $35 support levels could be touched. At the moment, looking at the daily chart, the technical indicator RSI (14) is seen moving below the 40-level, which may likely bring more bearish signals into the market.
Comparing with BTC, the Litecoin price is moving down slowly below the 9-day and 21-day moving averages. Looking at the daily chart, the bulls are trading at 6906 SAT following the downward trend as they continue to dance to the tune of the bears. The daily chart also reveals that the buyers are still suffering serious downtrend pressure from the sellers.
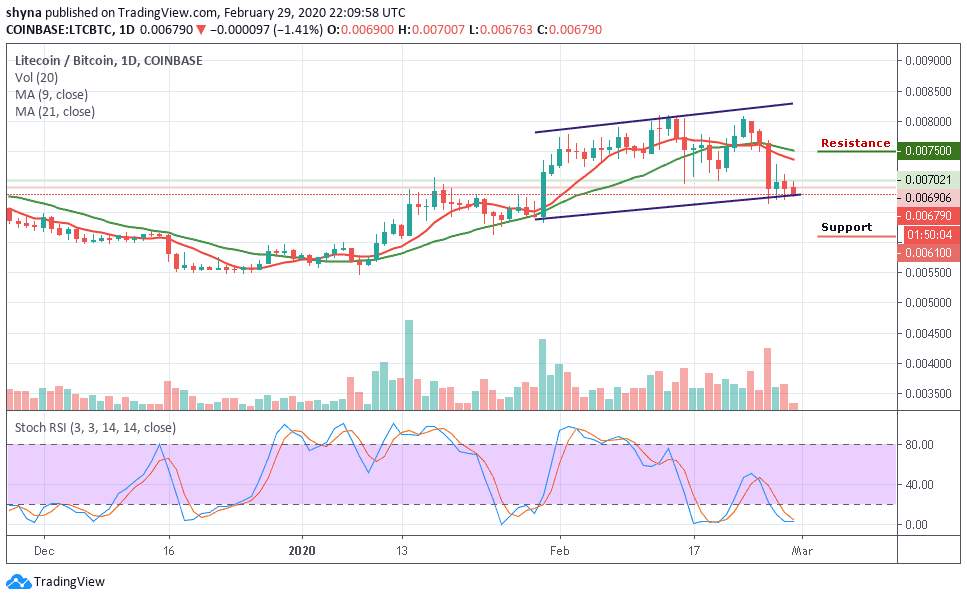
However, if the price cross below the lower boundary of the channel, the nearest key support lie at 6400 SAT, but further support could be found at 6100 SAT and 5700 SAT in a subsequent move. Similarly, an upward movement around the moving averages may likely find immediate resistance at 7500 SAT, If the bulls climb above this level, higher resistance lies at 8000 SAT and above. Meanwhile, the stochastic RSI is moving within the overbought zone.
Please note: Insidebitcoins.com is not a financial advisor. Do your research before investing your funds in any financial asset or presented product or event. We are not responsible for your investing results.
Join Our Telegram channel to stay up to date on breaking news coverage