Join Our Telegram channel to stay up to date on breaking news coverage
LTC Price Prediction – May 12
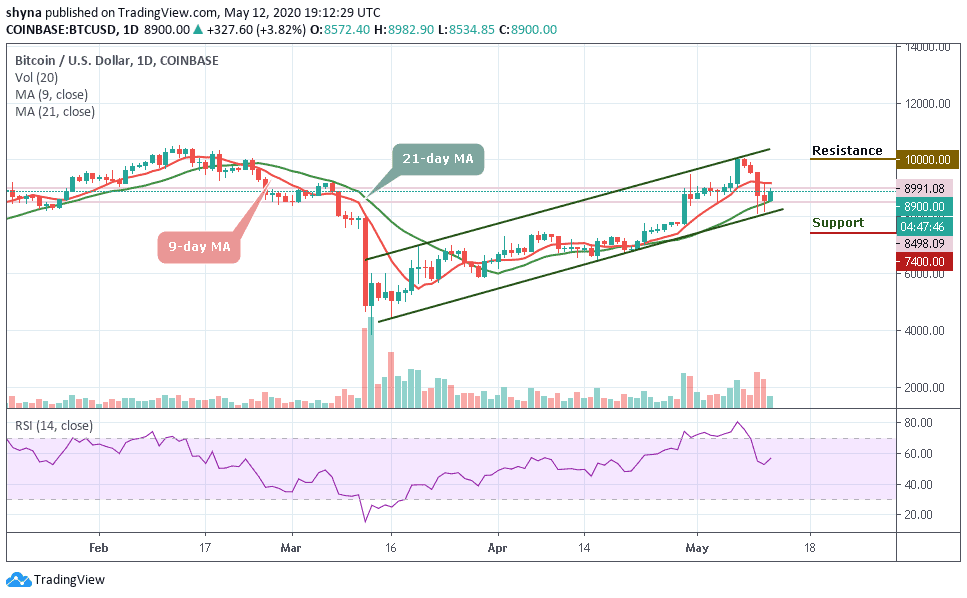
The price of the Litecoin is currently changing hands at $42.34 as the technical indicator moves above 40-level.
LTC/USD Market
Key Levels:
Resistance levels: $50, $52, $54
Support levels: $34, $32, $30
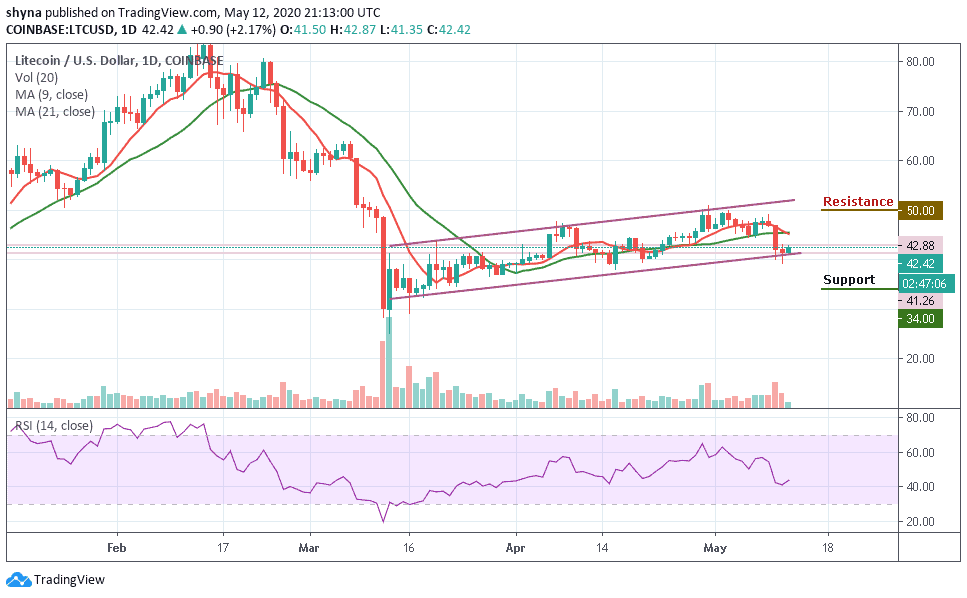
LTC/USD has been working on its recovery. At the time of writing, the Litecoin (LTC) price is hovering at $42.34, with 2.17% in the green. Furthermore, LTC/USD was trapped in an incredibly narrow trading range after a few days ago; the bullish rally has failed to materialize several times.
However, the Litecoin (LTC) is yet to clear the hurdles towards the resistance level of $45. Instead, the bears are trying to force their way back to the $38 support level. A break below $35 support level may provoke an even deeper decline towards the $34, $32 and $30 support levels. Looking at the RSI (14), Litecoin may exhibit the tendencies to follow an upward trend as the coin is still moving above the 40-level.
Moreover, if the bulls can gather enough strength and push the market above the 9-day and 21-day moving averages within the channel, then the price may likely hit the resistance levels of $50, $52, and $54 respectively. So, further movement above these key resistance levels should, therefore, encourage more buying.
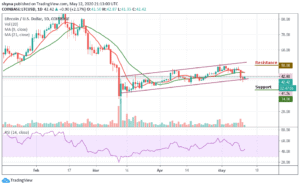
Against Bitcoin, LTC continues to trend bearishly as the support further outweighs the resistance. In case of a trend reversal, there is a need for an increasing volume and resistance to cause an upsurge in the market. Now, the token is trading around the 4810 SAT below the moving averages. We can expect close support at the 4100 SAT and beyond.

For now, there’s no sign of a bullish movement in the LTC market. However, if a bullish move occurs and validates a break significantly above the 9-day and 21-day moving averages to hit the nearest resistance at 5400 SAT; we can then confirm a bull-run for the LTC/BTC pair. More so, the closest resistance lies at 5500 SAT and 5700 SAT as the RSI (14) moves in the same direction at 30-level, suggesting sideways movement.
Please note: Insidebitcoins.com is not a financial advisor. Do your research before investing your funds in any financial asset or presented product or event. We are not responsible for your investing results.
Join Our Telegram channel to stay up to date on breaking news coverage