Join Our Telegram channel to stay up to date on breaking news coverage
LTC Price Prediction – October 3
Litecoin (LTC) will soon need to stage a meaningful short-term rally or the cryptocurrency could see a worrying decline back towards the $50 support level.
LTC/USD Market
Key Levels:
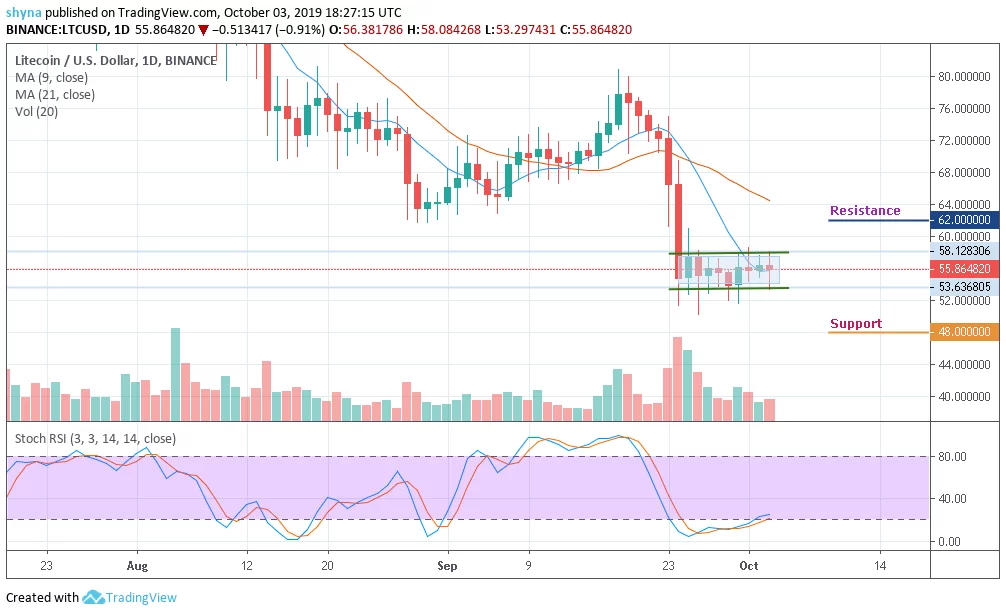
Supply levels: $62, $64, $66
Demand levels: $48, $46, $44
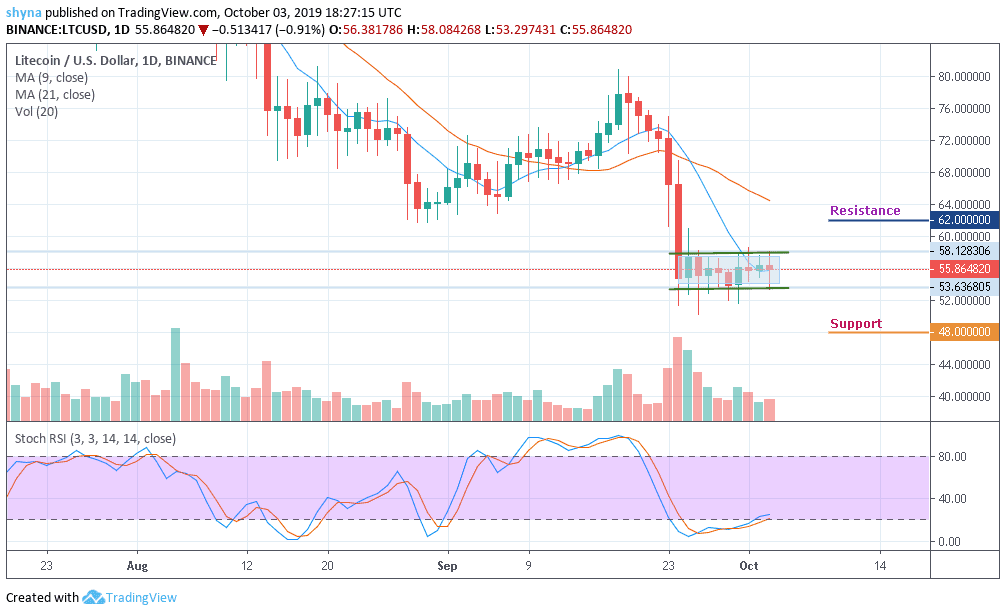
Litecoin is still trapped in an incredibly narrow trading range after a bullish rally failed to materialize. In fact, the cryptocurrency is trading in its tightest eight days trading band since late last month. An early day rally towards the $58 level failed to generate sustainable gains, with LTC/USD pair slipping back under the $56 level.
The longer that the LTC/USD pair fails to rally from current trading levels, the greater the chance that we may see the cryptocurrency falling to a new multi-month trading low. A break below the $53 support level may provoke an even deeper decline towards the $48, $46 and $44 levels. Short-term technical analysis shows that the $53 and $51 levels are currently the strongest forms of technical support before the $49 level starts to come back into focus.
Moreover, the daily chart highlights that the LTC/USD pair’s 9-day moving average, at the $58 level, is a key technical region which bulls need to break. The cryptocurrency’s 21-day moving average is located at the $62, $64 and $66 resistance levels, and a move above this key technical metric should encourage further LTC/USD buying.
Furthermore, the stochastic RSI for Litecoin is currently coming out of the oversold due to the past few days of bearish action in the market. If the bulls can regroup, the oscillator may climb back.
Against BTC, Ethereum price is attempting to rise towards the support turned resistance at 0.0068 BTC. Unless this resistance is effectively breached and the price ends up closing above it, there is not much reason to expect any long term bullish reversal.

However, a possible bearish continuation is likely to meet major support at 0.0065 BTC before falling back to 0.0062 BTC and below while the buyers could push the market to the critical potential resistances at 0.0073 BTC and above. The stochastic RSI moves to touch level 40 but may likely witness a bullish trend.
Please note: Insidebitcoins.com is not a financial advisor. Do your research before investing your funds in any financial asset or presented product or event. We are not responsible for your investing results.
Join Our Telegram channel to stay up to date on breaking news coverage