
Join Our Telegram channel to stay up to date on breaking news coverage
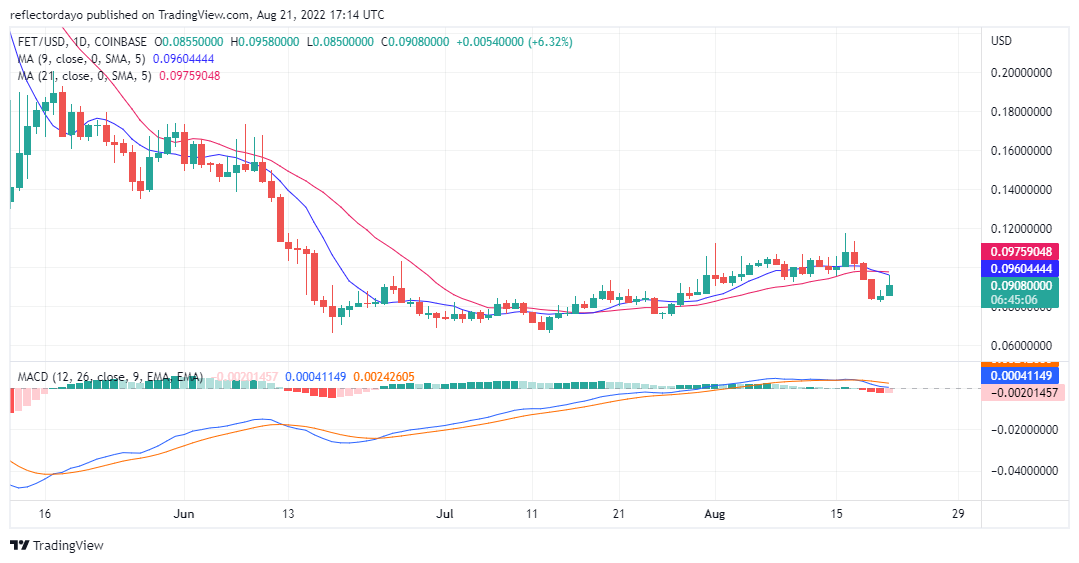
Selling pressure of FET/USD has been able to drive the price below the 21-day moving average, although both the bulls and the bears have not made the market lively. In a broad view, the bulls have slightly raised the trend of the market, before it starts to range sideways. the market consolidated between 7th August to 17th August. Then, The bears became strong enough to bring the price down. Then between yesterday and today, bulls began to push the market to the upside by a gain of 6.7%.
Fetch.ai Classic Price Statistic Data:
- FET/USD price now: $0.09611761
- FET/USD market cap: $67,680,162
- FET/USD circulating supply: 746,113,681 FET
- FET/USD total supply: 1,151,441,226 FET
- FET/USD coin market ranking: #320
Key Levels
- Resistance: $0.09611761, $0.10428091, $0.10777946
- Support: $0.08387266, $0.09495143, $0.07629246
Your capital is at risk
Fetch.ai Price Analysis: FET/USD The Consolidation and the Swing
From early July’s support level of $0.07337700, the market appears to be ranging till the 6th of July. Then the market took an up and down swing before the bulls begins to push the price up. Some of Those bullish moves from the 13th of August to the 16th of August were not strong moves, but they manage to keep the price considerably on the upside. They manage to keep the market on the upside until the 16th of August when the bears became stronger and drove the price below the 21-day and the 9-day moving average.
Fetch.ai Price Analysis: Information From the Indicators
The indicator shows that the price activities are trying to recover from the downswing from below the two moving averages. Today’s histogram of the Moving Average Convergence and Divergence shows that the price is rising. Today’s Light pink coloured histogram(instead of a red coloured) one is a sign that the price is rising.
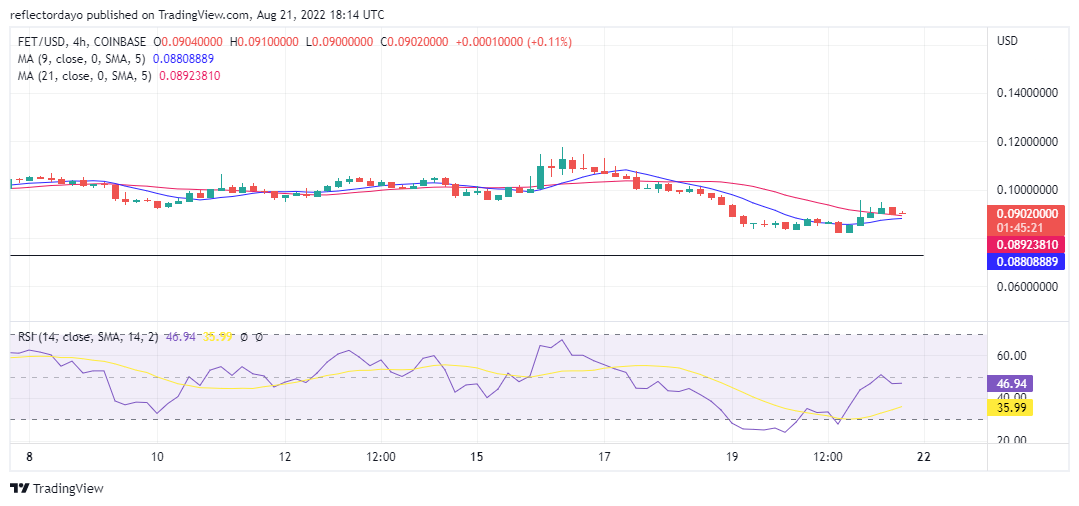
Quant Price Analysis: FET/USD 4-hour Chart Outlook
On the 4-hour chart, we discovered that the price entered the oversold region of the RSI. This resulted in a quick rebound which change the trend of the market. The RSI indication is not strong enough as it measures 46.7%.
Related
Join Our Telegram channel to stay up to date on breaking news coverage