Join Our Telegram channel to stay up to date on breaking news coverage
Bulls may take over Fantom Market soon
A breakout at the support level of $0.21 will decrease the price to $0.20 and $0.19 levels. Ability to push the Fantom above the resistance level of $0.23 by the bulls will drive the price to $0.25 and $0.26 levels.
Fantom Price Analysis – September 30
FTMUSD Market
Key levels:
Resistance levels: $0.23, $0.25, $0.26
Support levels: $0.21, $0.20, $0.19
FTMUSD Long-term Trend: Bearish
Fantom is on the bearish movement in daily chart. The price action is trying to form a Tripple bottom price action at $0.21 level. The first touch was on July 15, the price pulled back to test the resistance level of $0.41. Chord of wood candle pattern was produced and the price reduced to retest the support level of $0.21 level. The second test was carried out on September 18 and the price is currently consolidating around the mentioned support level.
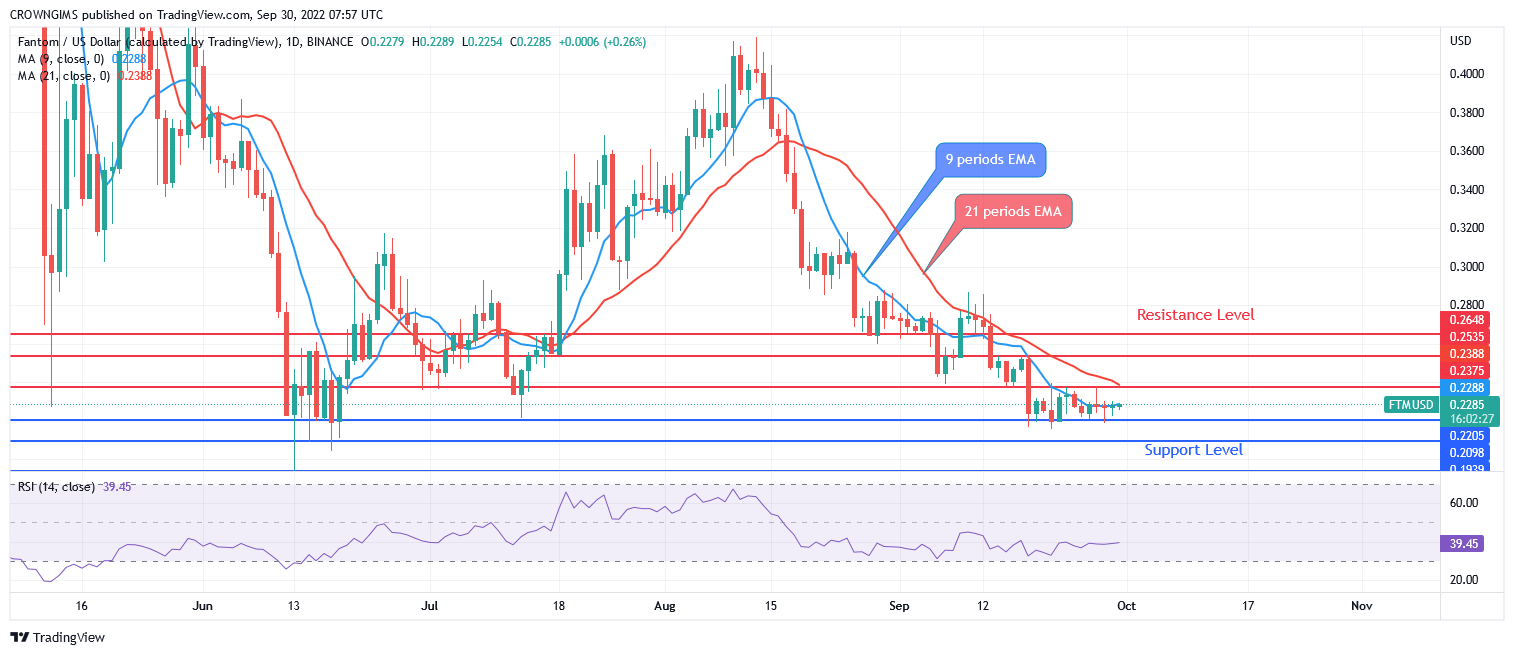
Fantom price is trading below the 9 periods EMA and 21 periods EMA. The relative strength index period 14 is at 39 levels with the signal line displaying no specific direction. A breakout at the support level of $0.21 will decrease the price to $0.20 and $0.19 levels. Ability to push the price above the resistance level of $0.23 by the bulls will drive the price to $0.25 and $0.26 levels.
Your capital is at risk
FTMUSD Medium-term Trend: Ranging
Fantom is on the ranging movement in the medium-term outlook. The support level of $0.22 holds when the bears pushed down the price. Bears lose their momentum and the bulls were unable to push it up. The price commences a consolidation movement within $0.23 and $0.22 levels. These may continue until there is a breakout.
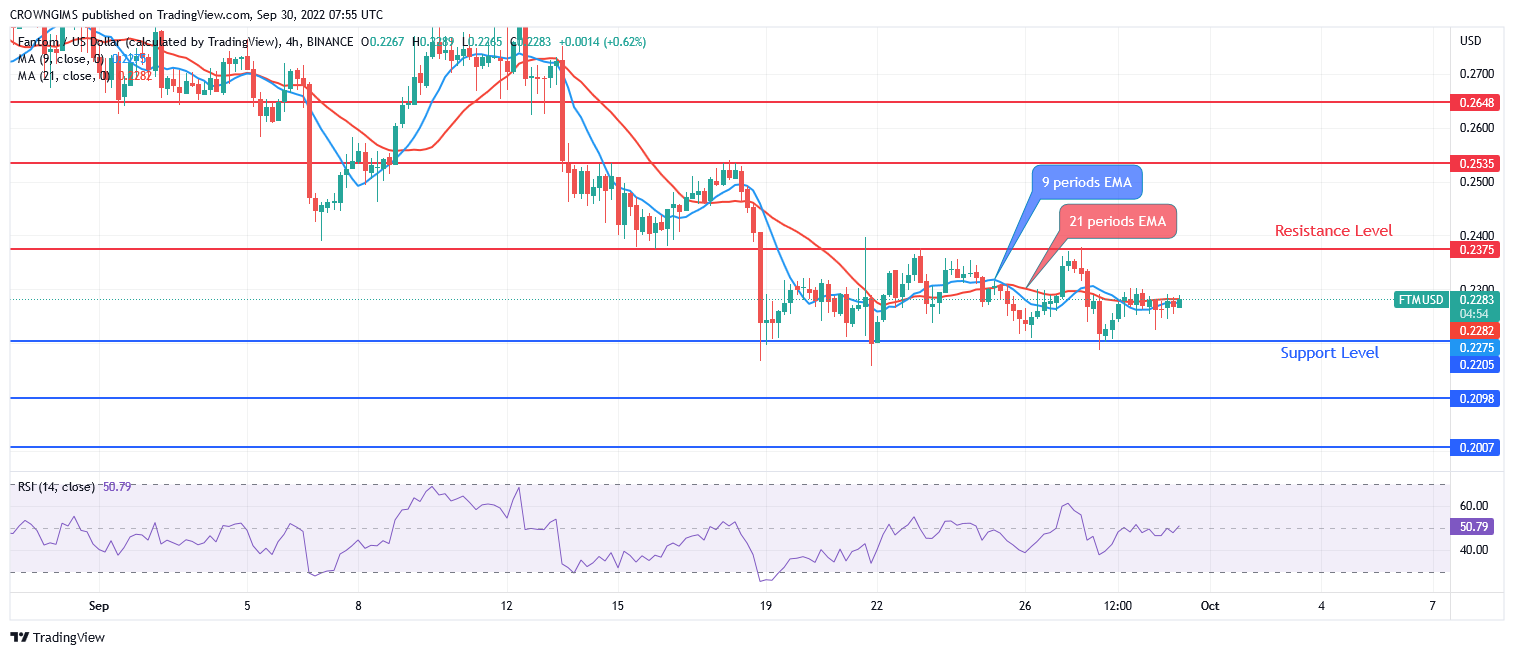
The two EMAs are not separated from each other and the price is trading between the two EMAs indicating ranging momentum. The Relative Strength Index period 14 is found at 51 levels and the signal line pointing up which indicate a buy signal.
Join Our Telegram channel to stay up to date on breaking news coverage