Join Our Telegram channel to stay up to date on breaking news coverage
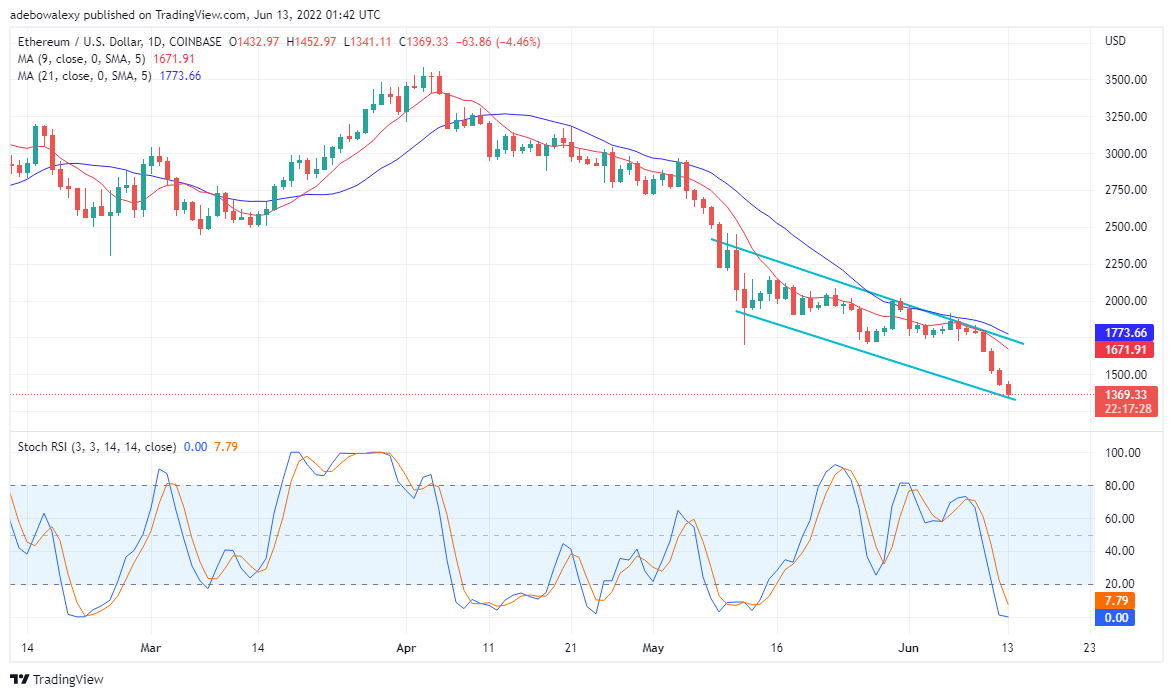
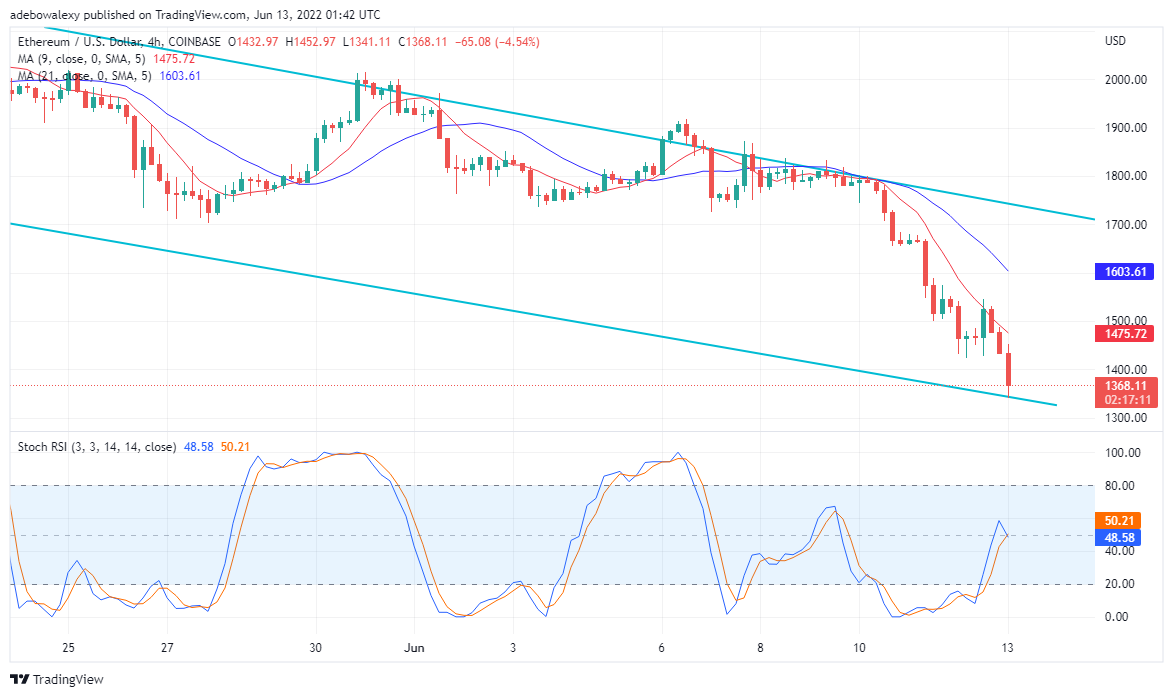
Ethereum price is sliding down a price channel in the range of about $1,300 -$1,700. The Ethereum chart shows that the bears are keeping a tight grip on ETH/USD price action.
ETH Current Price: $1,366.63
ETH Market Cap: $148.1 Billion
Total Supply: $121.2 Million
Rank: 2
Key Levels:
Resistance: $1,920, $1,9953.33, $2,016.79
Support: $1,501.79, $1,424.54, $1,380
The RSI indication plunges very quickly towards the oversold region. The RSI lines aren’t too far apart and may cross each other soon for a trend reversal.
Ethereum Price Prediction: The Search for a Trend Reversal
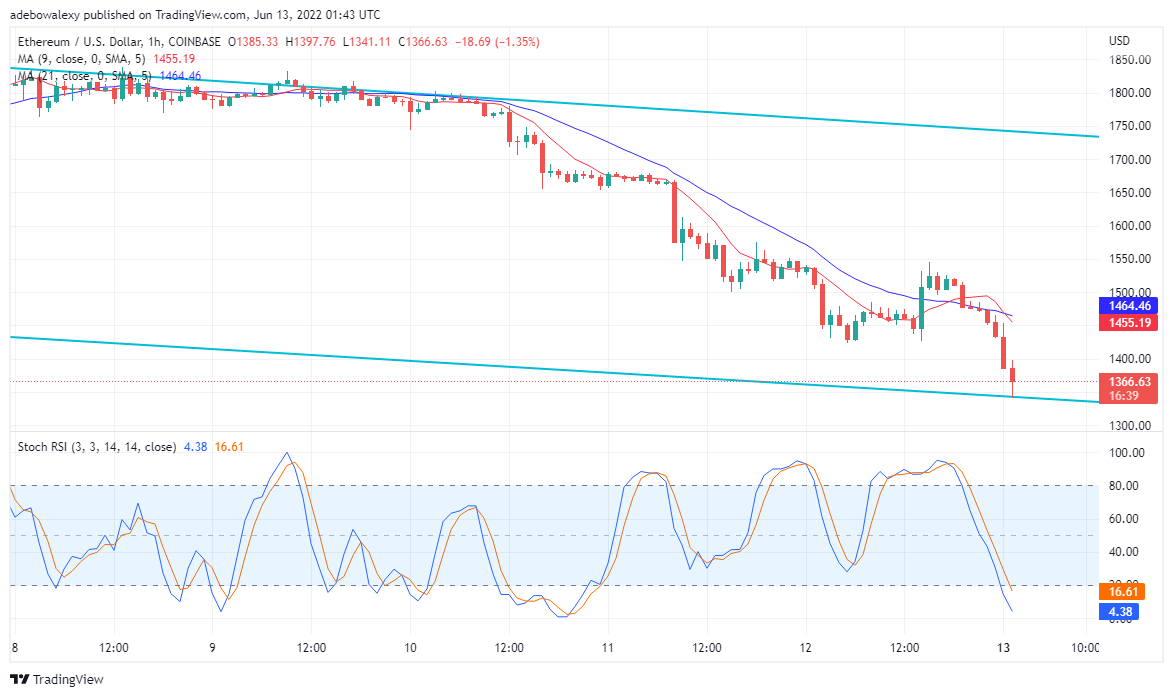
On the 1-hour chart, the price action falls under a newly crossed 9 and 22-days moving averages: giving ETH/USD its current price of $1,366.63. This indicates that the downtrend will continue for a longer time. This is because it will take more time before the MA lines will be able to cross under the price action for an uptrend to occur. Also, for an uptrend to occur, there is a need for bullishness in the market, and this is far-fetched given the number of bullish candles on the chart. In addition, the RSI indicator still shows no sign of crossing each other to indicate an uptrend.
Ethereum Price Prediction: ETH/USD Appears Not Ready for an Uptrend
On the ETH/USD 4-hour chart, the RSI lines are headings upward toward the bought region. However, this was a short-lived bullish hope, as the RSI lines make a sharp turn: crossing each other again. The crossing of the RSI lines indicates the onset of a downtrend, which might be a rather powerful one. Also, on the chart, the faster 9 -days MA attempted crossing under the price action to push it up, but failed.
The behavior of Ethereum’s price action indicates that more people are selling off the crypto, while fewer are buying. So, if more traders will buy the dip, perhaps the ETH/USD price action will be pulled up towards the $1,400 and $1,500 price levels.
Join Our Telegram channel to stay up to date on breaking news coverage