Join Our Telegram channel to stay up to date on breaking news coverage
ETH Price Prediction – May 24
At the early hours of today, ETH/USD surges from $206 to $210 but it may trade above $220 in the coming week
ETH/USD Market
Key Levels:
Resistance levels: $230, $240, $250
Support levels: $180, $170 $160

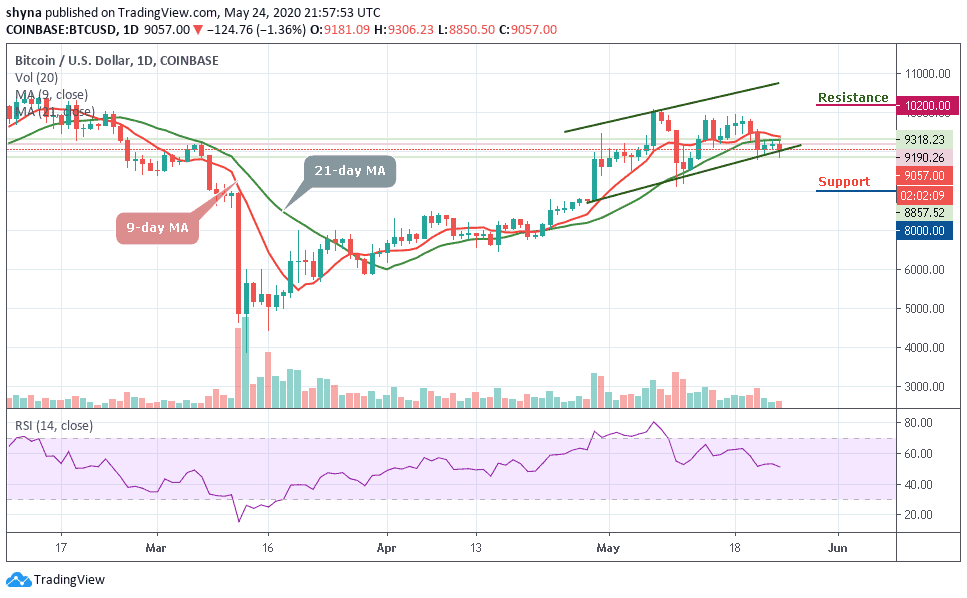
Today, Ethereum ETH/USD saw a small price decline at $201.83 level and it is currently trading at $206.54. The cryptocurrency continues to be supported at the $200 level but it seems that the bears are adamant to push the coin lower. More so, the price to buy Ethereum is down with 0.06% at the time of writing.
However, ETH/USD may be trading sideways within the channel formation, around the 9-day and 21-day moving averages. Today, after the opening of the market, the daily price chart shows that ETH/USD fell from $210.65 to $201.83, where it found short-term support and later bounced up to $06.54, where it is currently trading.
Nevertheless, for a backward movement, the market can be supported at $180 and $170 levels, if the price falls below the previous levels; another support is around $160. But should in case the price exceeds the indicated level by moving upward, then, the resistance levels of $230, $240 and $250 may be visited. Meanwhile, the RSI (14) is moving in the same direction, which may cause the market to move in sideways.
Against Bitcoin, ETHBTC is bullish. The price is forming a bullish trend on the chart and it is above the 9-day and 21-day moving averages consolidating. The bulls are still pushing the price upward but if they are able to maintain the trends, the price may likely hit the resistance levels at 0.0250 BTC and above.
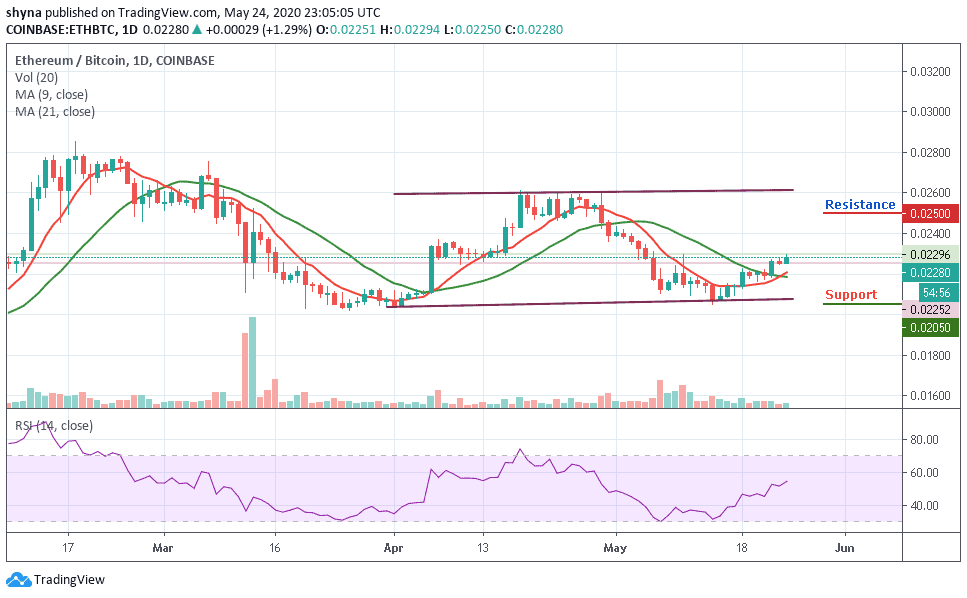
Moreover, Ethereum has been trending within the channel but any retracement could bring the price to the nearest support level and this may reach the major support level of 0.0205 BTC and below. Additionally, the technical indicator RSI (14) is seen moving towards 60-level, which may give more bullish signals in the nearest term.
Please note: Insidebitcoins.com is not a financial advisor. Do your research before investing your funds in any financial asset or presented product or event. We are not responsible for your investing results.
Join Our Telegram channel to stay up to date on breaking news coverage