Join Our Telegram channel to stay up to date on breaking news coverage
ETH Price Prediction – March 29
Ethereum loses more than 2% in one day and goes below $130 level while the next target support for the coin may surface at $120.
ETH/USD Market
Key Levels:
Resistance levels: $155, $160, $165
Support levels: $105, $100, $95

Looking at the daily chart, since a couple of days ago, ETH/USD has been bitten by the bears as the coin is currently experiencing a price drop. Meanwhile, traders were expecting a lot from the coin, although March 23 and 24 reflected an improvement in ETH prices. The Ethereum (ETH) and some other cryptocurrencies started with a fall today as the price is currently moving under the 9-day and 21-day moving averages and exchanging hands at $128.43 which is yet to break out to the upside or downside.
Furthermore, a bearish drop may continue to roll the market down to $105, $100 and $95 support levels while possible bullish surge may drive the market to $140 level, testing the upper channel boundary. Above the channel, $155, $160 and $165 may further provide resistance levels for the market. The RSI (14) signal line is sitting on 40-level and staying there may cause the coin to be moving in sideways.
Currently, according to the chart, one can simply say that the market is experiencing an indecisive movement.
When compared with Bitcoin, the market price remained within the descending channel as the bulls are pushing to the north. The Ethereum pair is currently trading at 0.021 BTC. More so, if the market continues to rise, the next key resistance for the coin may likely be at 0.023 BTC and above.
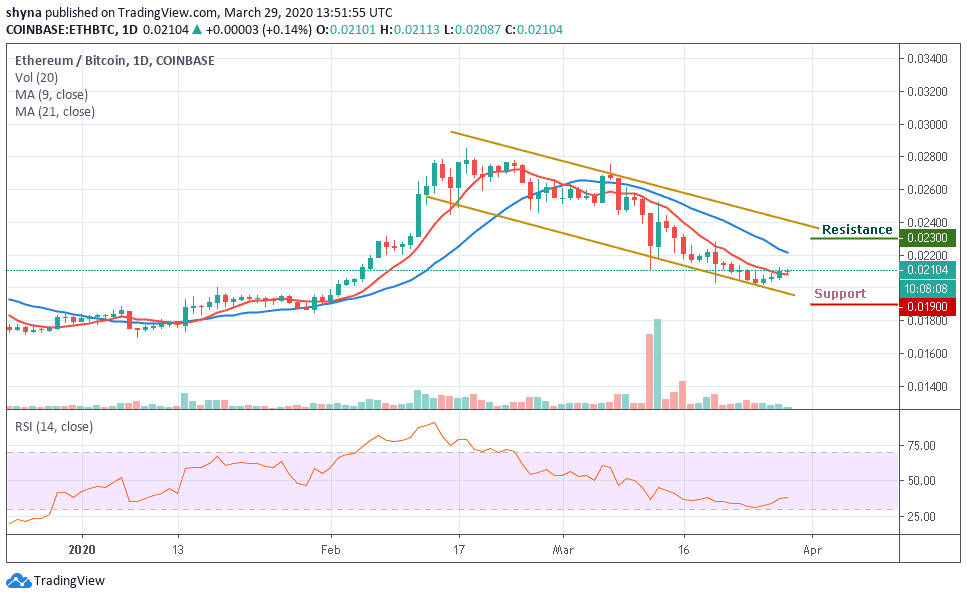
Moreover, a possible bearish movement may likely drag the market below the 9-day moving average before crossing the lower limit of the descending channel, when this is done, the support level of 0.019 BTC and below could be visited but the RSI (14) is moving around 37-level and this indicates that the market is coming up slowly.
Please note: Insidebitcoins.com is not a financial advisor. Do your research before investing your funds in any financial asset or presented product or event. We are not responsible for your investing results.
Join Our Telegram channel to stay up to date on breaking news coverage