Join Our Telegram channel to stay up to date on breaking news coverage
ETH Price Prediction – April 8
ETH/USD bullish action is breaking above the $200 barrier as the coin currently focuses on a $2100 resistance level.
ETH/USD Market
Key Levels:
Resistance levels: $2200, $2300, $2400
Support levels: $1800, $1700, $1600
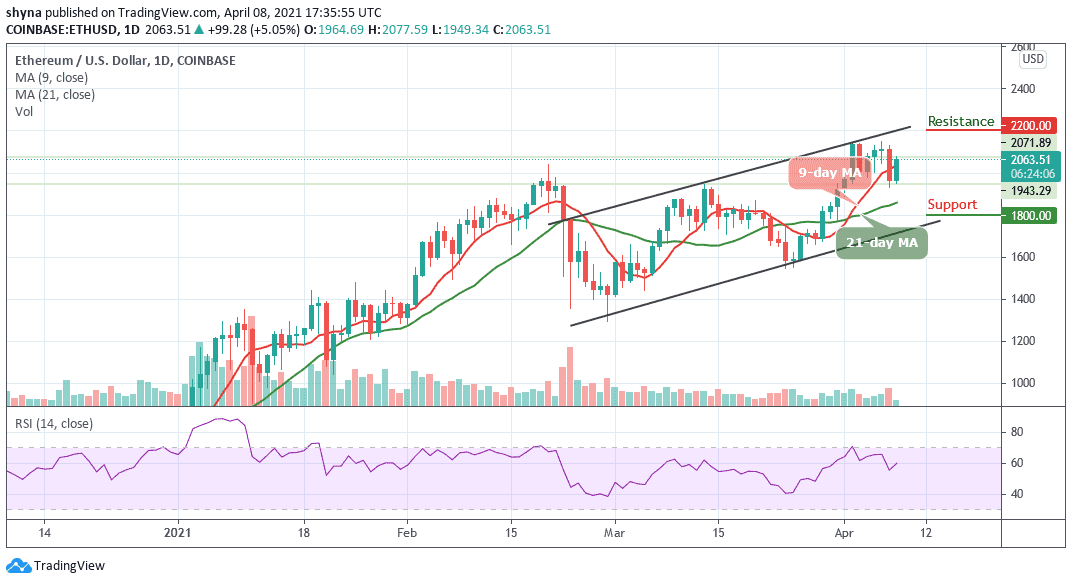
ETH/USD begins to refresh above the 9-day and 21-day moving averages in order to remain above the $2000 resistance level as the coin currently trades at $2063 with a bullish crossover in the intraday. At the time of writing, ETH/USD touches the daily high of $2077. Higher support at $1950 is expected to be a stepping stone for a comeback below $2000 but the majestic rally could eye $2100 resistance level.
What to Expect from Ethereum (ETH)
Looking at the daily chart, parallel trade can only take over in the ETH trading if the $2000 subsidy is maintained at all costs. At the moment, the technical indicator RSI (14) is about to cross above the 60-level by sending the bullish signals to the upside and this may encourage more buyers to enter the market.
Meanwhile, the coin may continue to do well and the price could hit the resistance levels at $2200, $2300, and $2400 in as much as the 9-day MA stays above the 21-day MA, More so, if the technical indicator decides to make a quick turn back to the lower side, then, there may be a quick bearish drop within the channel and this may likely roll the market down to the support levels of $1800, $1700, and $1600.
Against BTC, Ethereum is trading above the 9-day and 21-day moving averages as the price is now hovering at 0.035 SAT as the technical indicator RSI (14) moves above the 60-level. Meanwhile, for the fact that the market follows the descending channel, the pair seems to be moving towards the upper boundary of the channel to cross into the upside.
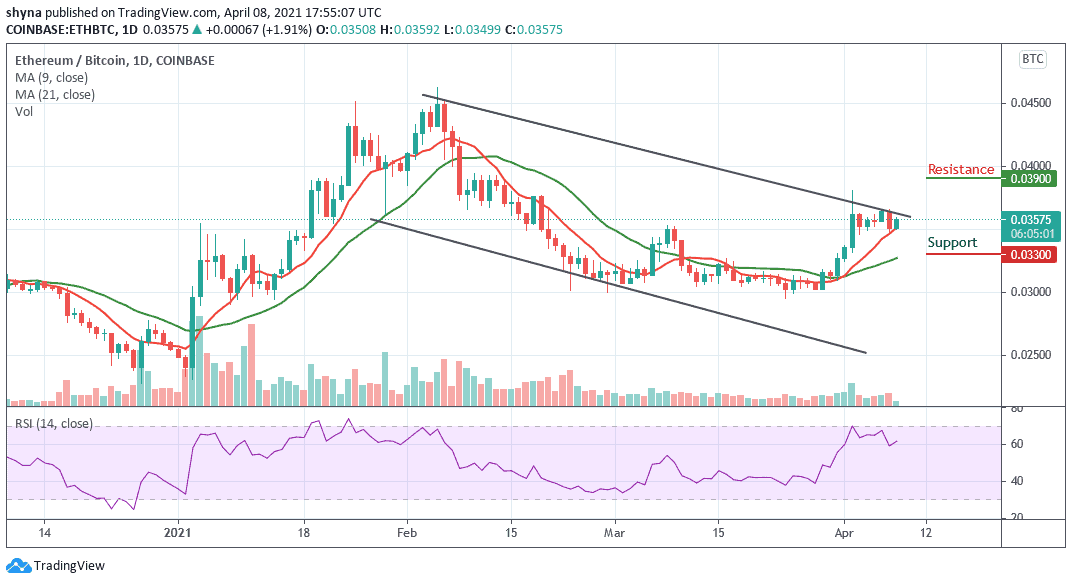
However, if this comes to pass, the resistance levels to be reached are located at 3900 SAT and 4000 SAT. On the other hand, a higher sustainable move below the moving averages may likely cancel the bullish pattern and could attract new sellers coming into the market with the next focus on 3300 SAT and 3200 SAT support levels.
Join Our Telegram channel to stay up to date on breaking news coverage