Join Our Telegram channel to stay up to date on breaking news coverage
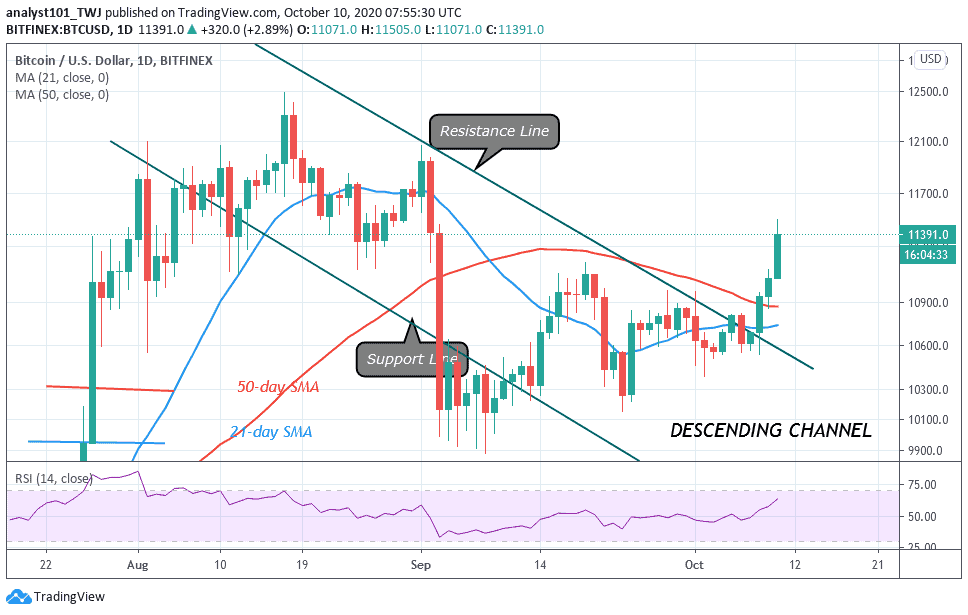
ETH Price Prediction – October 10
ETH/USD is seen climbing higher and settling above the main $370 barrier.as the coin remains above the moving averages.
ETH/USD Market
Key Levels:
Resistance levels: $420, $440, $460
Support levels: $328, $208, $188
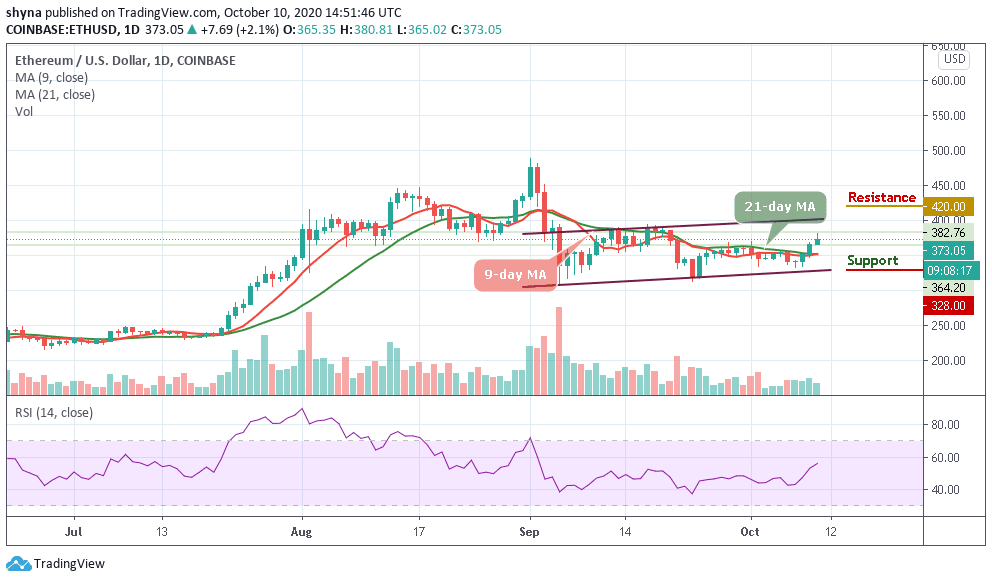
ETH/USD has been following the bullish trend and did the same yesterday as well. It is making a gain of almost 2.1% and touches the daily high of $380.81. However, amidst that, the coin is managing to keep its price above the 9-day and 21-day moving averages. Traders can expect Ethereum to prepare itself steadily for a ride towards $400.
Where is ETH Price Going Next?
In the last two days, Ethereum has moved from $334 to $380 and at the same time moving towards the upper boundary of the channel at the time of writing. The on-going trend may move a little bit higher in the coming week if the 9-day MA is successfully cross above the 21-day MA and the coin may likely reach the nearest resistance at $400, any further bullish movement could hit additional resistance levels at $420, $440, and $460 respectively.
However, a bearish drop may roll the market back below the 9-day and 21-day moving averages and also to the initial support level of $330. Meanwhile, the support levels to watch are $328, $308, and $188. As the trading volume increases, the technical indicator RSI (14) is seen moving to cross above the 60-level and this indicates that more bullish signals may come to play.
When compared with Bitcoin, Ethereum is currently trading above the 9-day and 21-day moving averages. The price is changing hands at 3293 SAT as the technical indicator RSI (14) moves below the 50-level. However, the daily chart reveals that the coin is retreating after touching the daily high of 3328 SAT.
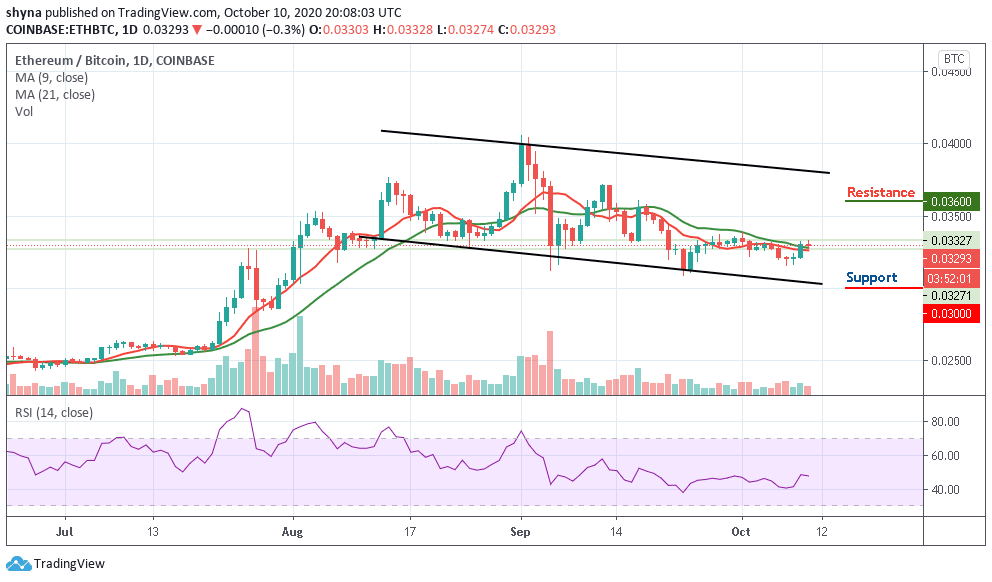
Negatively, the critical support levels are located at 3000 SAT and below. Inversely, a higher sustainable move may likely cancel the bearish pattern and it could attract new buyers to the market with the next resistance at 3600 SAT and above.
Join Our Telegram channel to stay up to date on breaking news coverage