Join Our Telegram channel to stay up to date on breaking news coverage
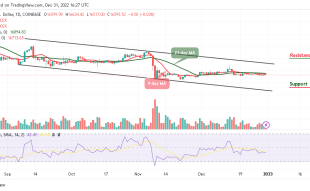
As the coin begins the bullish movement toward the upside, the dYdX price prediction is likely to move consistently within the channel.
dYdX Prediction Statistics Data:
- DYDX price now – $1.10
- DYDX market cap – $72.7 million
- DYDX circulating supply – 65.5 million
- DYDX total supply – 1 billion
- DYDX Coinmarketcap ranking – #198
DYDX/USD Market
Key Levels:
Resistance levels: $2.00, $2.20, $2.40
Support levels: $0.50, $0.30, $0.10
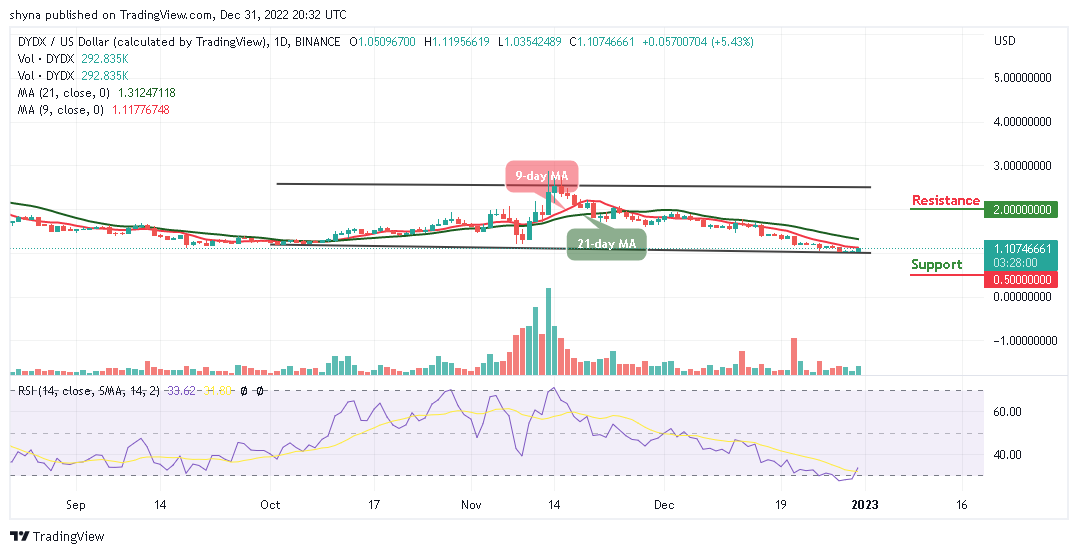
DYDX/USD is likely to cross above the 9-day and 21-day moving averages as the coin begins the upward movement. In the last few days, the dYdX price has been struggling to cross into the positive side. According to the daily chart, the technical indicator Relative Strength Index (14) is moving to cross above the 40-level, confirming the bullish movement for the coin.
dYdX Price Prediction: DYDX Ready for the Upside
The dYdX price is currently moving to the north. If the coin continues with the bullish movement, the bulls may cross above the 9-day and 21-day moving averages, which could hit the resistance levels of $2.00, $2.20, and $2.40. At the time of writing, DYDX/USD shows a slight bullish movement within the daily chart.
On the contrary, if the coin slides below the lower boundary of the channel, it could return the coin to the support levels of $0.50, $0.30, and $0.10 respectively. Meanwhile, the long-term buyers should not be bothered by the small impact on the road, as the future of DYDX is assured as revealed by the technical indicator Relative Strength Index (14).
Against Bitcoin, the dYdX price is hovering below the 9-day and 21-day moving averages as the coin prepares for a bullish movement. The technical indicator Relative Strength index (14) is also confirming the bullish movement as the signal line faces the 40-level. On the contrary, a possible fall could surface if the market price crosses below the lower boundary of the channel, which could hit the support level of 200 SAT and below.
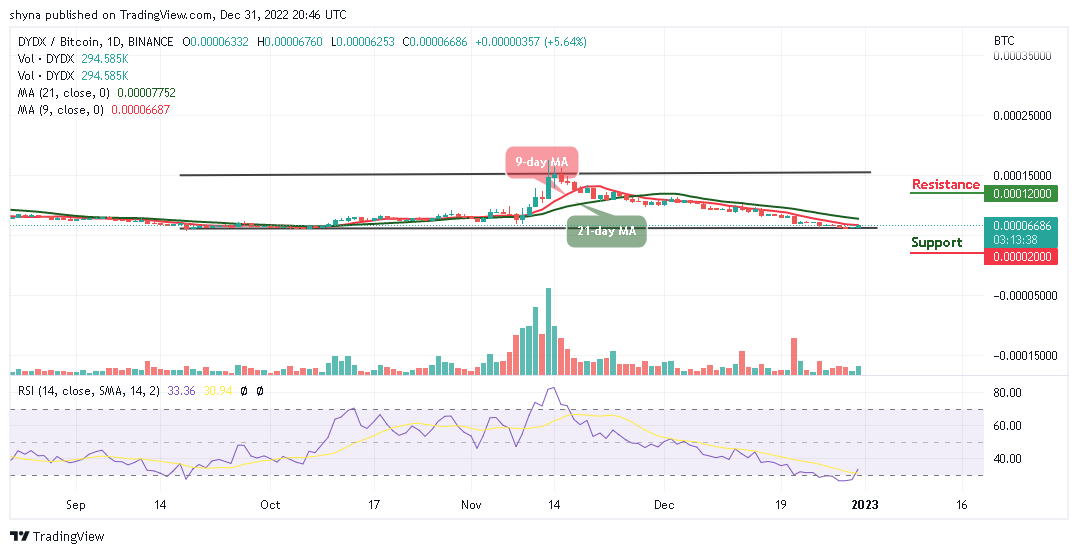
Meanwhile, any further bullish movement above the moving averages could push the coin to the resistance level of 1200 SAT and above, this could take the coin to a new high, and the market may remain in the bullish zone.
However, Dash 2 Trade gives you the ability to optimize your trading and speculative profitability with effective crypto trading recommendations, auto trading, and analytics features. There is a D2T token presale ongoing and time is running out. The presale dashboard launch is coming soon since the product dev is ahead of the schedule. So far, the presale has raised almost $12 million.
Related
Join Our Telegram channel to stay up to date on breaking news coverage