Join Our Telegram channel to stay up to date on breaking news coverage
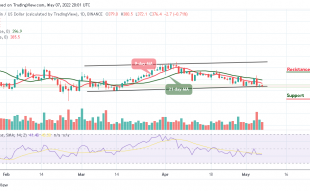
According to the daily chart, the Cardano price prediction slides below the moving averages as the coin trades below the $0.80 level.
ADA/USD Market
Key Levels:
Resistance levels: $1.10, $1.20, $1.30
Support levels: $0.50, $0.40, $0.30

ADA/USD is currently falling below the 9-day and 21-day moving averages as the coin heads to the south. However, as the bears step back into the market, the Cardano price is seen losing momentum below the moving averages along with a potential price surge.
Cardano Price Prediction: ADA/USD May Follow the Downtrend
The Cardano price is moving sideways as the coin the bears take charge of the market. Meanwhile, a bullish cross above the 9-day and 21-day moving averages is needed to correct the immediate bearish pressure and take the coin back on the recovery trend. Once it is out of the way, the upside is likely to gain traction with the next focus at the resistance levels of $1.10, $1.20, and $1.30.
However, on the downside, once the support level of $0.75 is broken, the sell-off could gain traction with the next focus at the nearest support level of $0.60, which could be followed by the nearest support level of $0.55. Therefore, if these levels are broken, the downside pressure may increase and the next support is created by the critical supports at $0.50, $0.40, and $0.30 as the technical indicator Relative Strength Index (14) moves to cross below the 40-level.
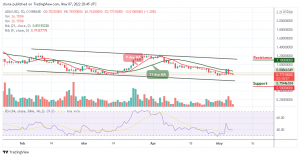
ADA/BTC Market: Cardano Price Remains At the Downside
Compared with BTC, the Cardano (ADA) is following a downward trend as revealed by the technical indicator Relative Strength Index (14). Although the market price is unstable as it hovers around 2165 SAT. Meanwhile, a low swing could push the coin to the support level of 1800 SAT and below. At the moment, the bears are in control as the Relative Strength Index (14) may stay below 50-level.
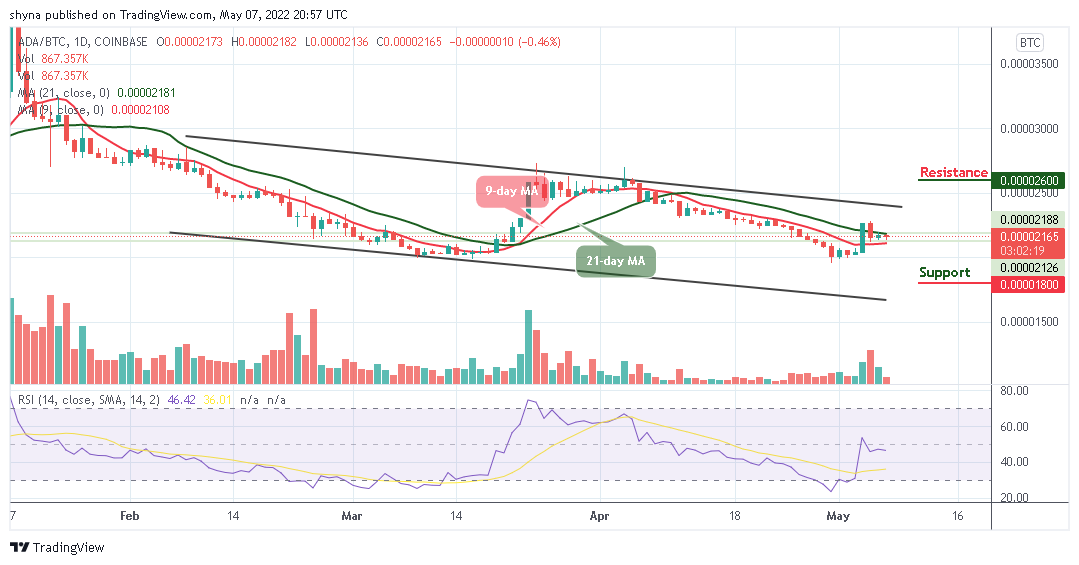
On the other hand, a rebound may occur if the buyers could defend the 2100 SAT and push it above the 21-day moving average which could help the coin to hit the potential resistance level of 2600 SAT and above.
Read more:
Join Our Telegram channel to stay up to date on breaking news coverage