Join Our Telegram channel to stay up to date on breaking news coverage
Bitcoin (BTC) Price Prediction – September 2
The Bitcoin price dropped from $11,950 to $11,160 in less than a few hours but managed to recover a little bit.
BTC/USD Long-term Trend: Ranging (Daily Chart)
Key levels:
Resistance Levels: $12,450, $12,650, $12,850
Support Levels: $10,850, $10,650, $10,450
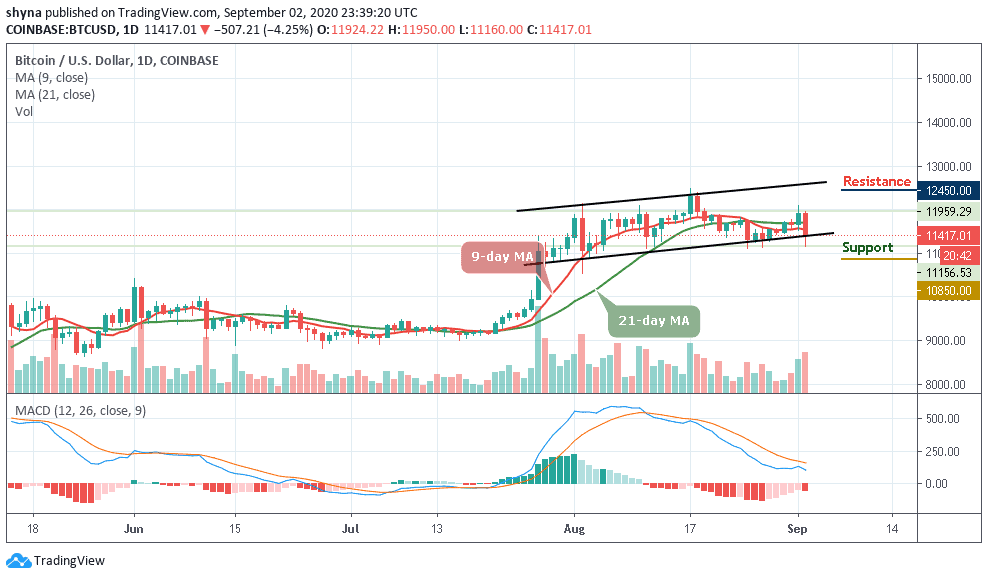
BTC/USD is trading down marginally at its current price of $11,417. The first digital asset is falling below $11,500 and undergoing rejections at $12,000 is not positive for the bull case. Although the bulls have tried and failed on multiple separate occasions to gather enough buying pressure to break $12,000, each attempt has failed simultaneously.
What Is the Next Direction for Bitcoin?
The Bitcoin price is currently trading below the 9-day and 21-day moving averages after an attempt by the bears to take the price down to $11,000. The move happened in less than one hour after Bitcoin dropped below 9-day MA at $11,160 which is an important support level on the daily chart but the bulls managed to bounce back up from $11,160 to $11,417 where it is currently trading.
However, it is important to note that Bitcoin’s inability to post any sustained closes above the $12,000 region shows that it is currently plagued by underlying weakness. This consolidation phase has given rise to a plethora of bearish divergences that may cause the cryptocurrency to see a notable retrace in the days ahead.
Nevertheless, the potential resistance levels for the coin are located at $12,450, $12,650, and $12,850 while the critical supports lie at $10,850, $10,650, and $10,450 as the MACD moves to the south, suggesting more bearish signals.
BTC/USD Medium-Term Trend: Ranging (4H Chart)
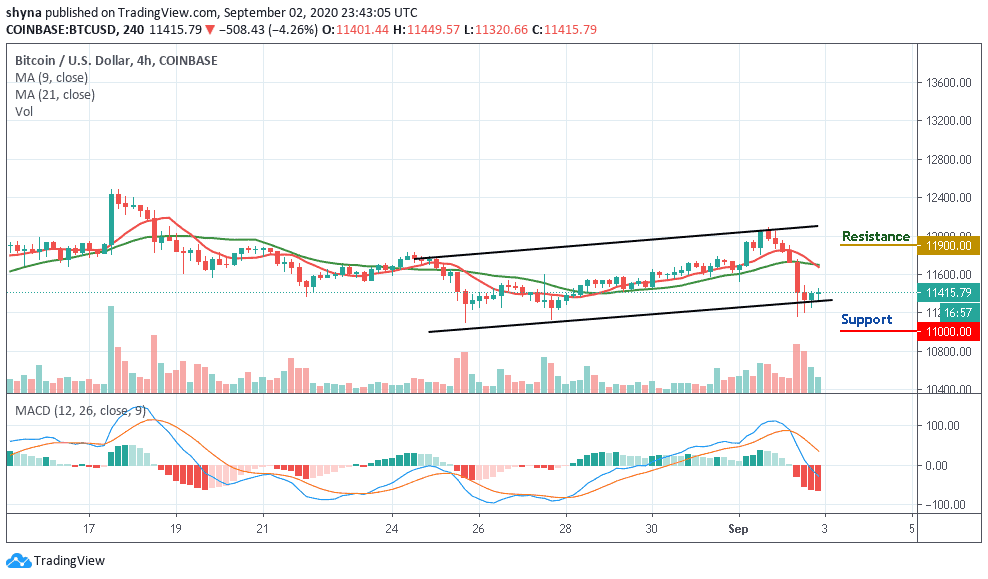
On the 4-Hour chart, the immediate support is below the moving averages at the $11,500 level. The price may likely fall below $11,300 if the bears fully stepped back into the market, a further movement could test the critical support at the $11,000 level and below while the resistance is located above the moving averages at the $11,900 and above. Technically, Bitcoin is currently moving sideways while the MACD moves to cross into the negative side.
Join Our Telegram channel to stay up to date on breaking news coverage