Join Our Telegram channel to stay up to date on breaking news coverage
Bitcoin (BTC) Price Prediction – November 17
BTC/USD is up by more than 5.19% as the price struck a sudden and bullish price spike above the $17,800 resistance level.
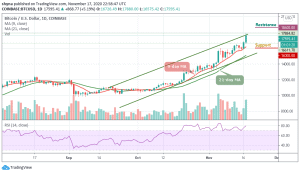
BTC/USD Long-term Trend: Bullish (Daily Chart)
Key levels:
Resistance Levels: $18,600, $18,800, $19,000
Support Levels: $16,000, $15,800, $15,600

The daily chart reveals that BTC/USD is flexing muscles above the critical resistance level. The coin moves above $17,700 to touch the daily high of $17,880 but now trading at $17,595 at the time of writing. The first digital asset is moving with strong bullish momentum above the 9-day and 21-day moving averages after a sustainable break above an important technical level.
What to Expect from Bitcoin (BTC)
As the Bitcoin breaks above the upper boundary of the channel, the return above $17,800 could set the framework for gains towards $18,200. Meanwhile, the technical analysis shows that the bulls are ready for another action especially when the up-trending RSI (14) is considered. Any further bullish movement above the daily high could pave the way for gains above $18,500. Other resistance levels may be located at $18,600, $18,800, and 19,000.
On the other hand, if the price falls back below the $17,000 level, breaking below the moving averages may cause the bears to wrestle out the control over the situation very quickly. This may likely serve as a major blow for the market sentiments as traders could interpret it as a sign of underlying weakness. The next important support may come at $16,500 while other supports may be located at $16,000, $15,800, and $15,600.
BTC/USD Medium – Term Trend: Bullish (4H Chart)
Looking at the 4-hour chart, the price of Bitcoin (BTC) is currently trading around $17,698 above the 9-day and 21-day moving averages. However, the 4-hour chart shows that the bullish supply is still very strong in the market while the bears are also trying to bring the price down.
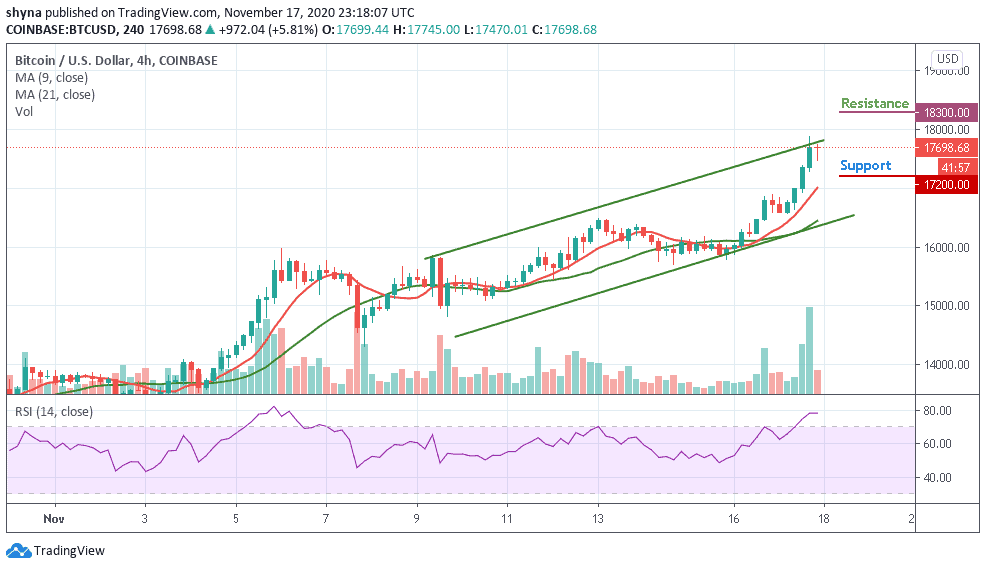
Meanwhile, if the buyers could put more pressure, they can further push the price above the $18,000 resistance level. Therefore, breaking the mentioned resistance could allow the bulls to hit another resistance at $18,300 and above. In other words, the RSI (14) is currently moving within the overbought region, leaving this zone could push the market price to the support level of $17,200 and below.
Join Our Telegram channel to stay up to date on breaking news coverage