Join Our Telegram channel to stay up to date on breaking news coverage
Bitcoin (BTC) Price Prediction – September 30
The Bitcoin price is trading above $10,700 against USD and the coin is likely to climb steadily with a few downward moves.
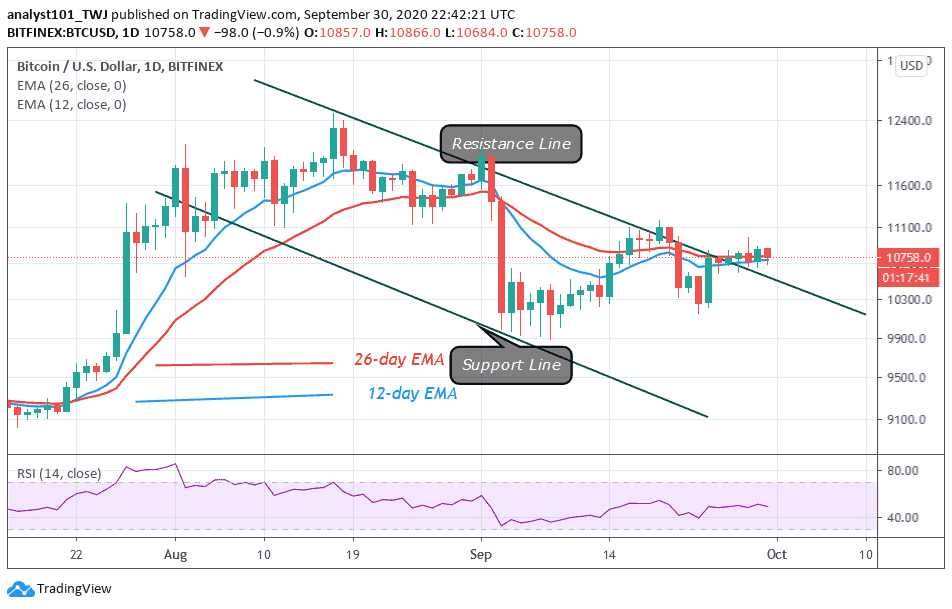
BTC/USD Long-term Trend: Bullish (Daily Chart)
Key levels:
Resistance Levels: $11,600, $11,800, $12,000
Support Levels: $10,000, $9,800, $9,600
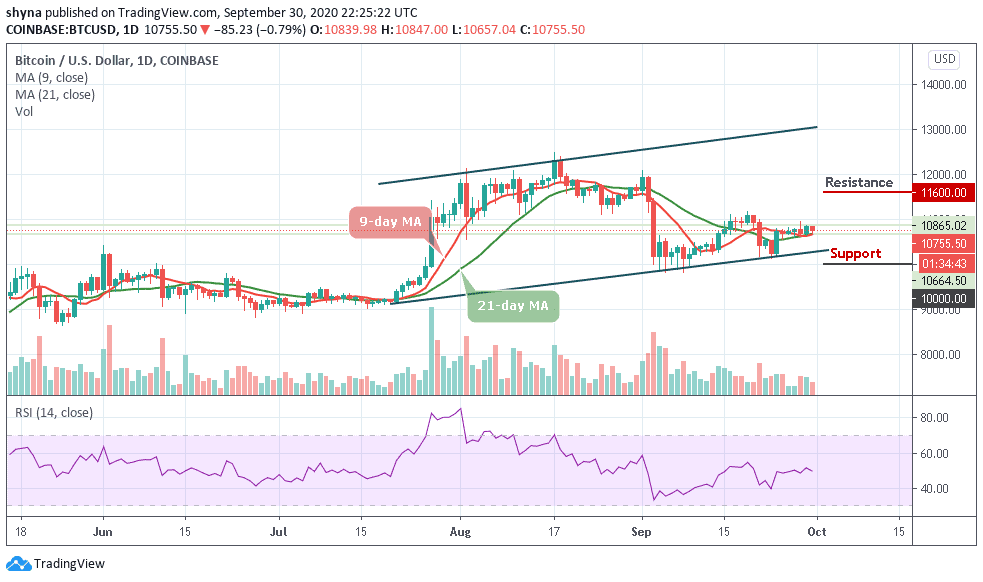
It is safe to say that Bitcoin has been turbulent in recent days, after tight trading for a few weeks with relatively low volatility. A few days ago (September 24), the Bitcoin price rose sharply by moving above the resistance levels of $10,500 and $10,700 against the US dollar. At the moment, the price is declining and is moving close to the 9-day and 21-day moving averages at $10,755.
What is the Next Direction for Bitcoin?
A crucial uptrend could probably form if the coin remains above the moving averages, with support close to $10,500 on the daily chart. However, if the decline occurs below the moving averages, the price could extend its downward correction to the lower boundary of the channel and any other loss could possibly push the price of Bitcoin to the support level of $10,200.
More so, a further sell may cause the market to reach the critical supports at $10,000, $9,800, and $9,600. In other words, if the market were to rebound, traders could see the next buying pressure towards the resistance levels of $11,600, $11,800 and $12,000 with the technical indicator RSI (14) remains below average.
BTC/USD Medium-Term Trend: Bullish (4H Chart)
Looking at the 4-hour chart, Bitcoin’s price is currently trading around $10,758 and above the 9-day moving average after a reversal from $10,681. Meanwhile, traders can see that the bullish supply is becoming steady in the market while the bears are also trying to drag the price down.
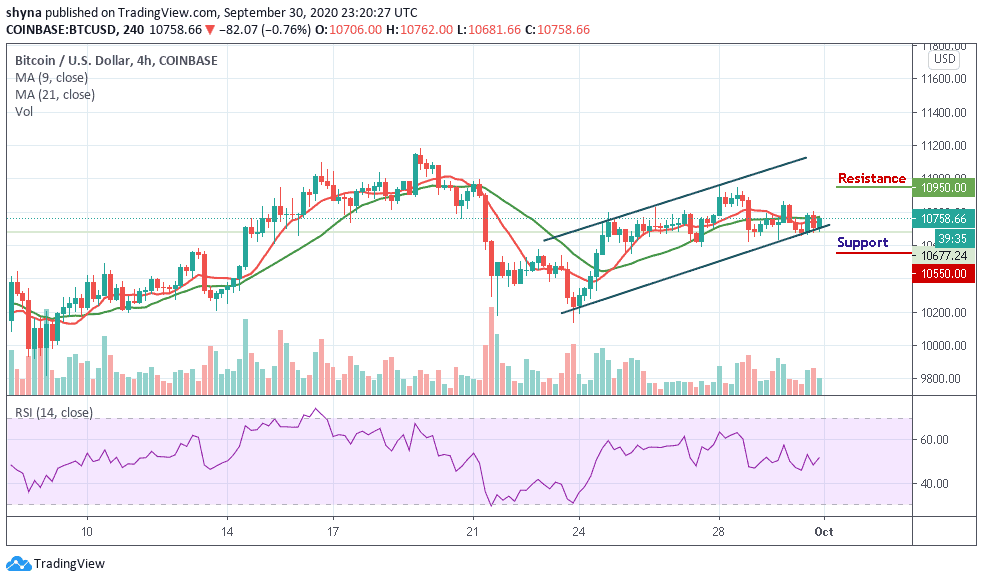
However, if the buyers can strengthen and energize the market, they can further push the price to a $10,900 resistance level. Therefore, breaking the mentioned resistance could also allow the bulls to test the $10,950 and above. Inversely, the RSI (14) is currently moving around 52-level, turning down may cause the bears to step back which could drag the price to the support level of $10,550 and below.
Join Our Telegram channel to stay up to date on breaking news coverage