Join Our Telegram channel to stay up to date on breaking news coverage
At the time of writing, the Bitcoin price prediction is dropping over 1.29% within 24 hours as it trades around the $19,991 level.
Bitcoin Prediction Statistics Data:
Bitcoin price now – $19,991
Bitcoin market cap – $381.0 billion
Bitcoin circulating supply – 19.0 million
Bitcoin total supply – 19.0 million
Bitcoin Coinmarketcap ranking – #1
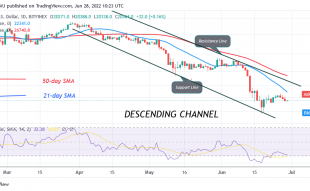
BTC/USD Long-term Trend: Bearish (Daily Chart)
Key levels:
Resistance Levels: $28,000, $30,000, $32,000
Support Levels: $15,000, $13,000, $11,000
The daily chart reveals that BTC/USD failed to break above the 9-day moving average. However, the Bitcoin price begins the day off by trending lower towards the support level of $19,000 and probably heading towards the lower boundary of the channel. However, the first support level is $17,000. Beneath this, other supports lie at $15,000, $13,000, and $11,000.
Bitcoin Price Prediction: Bitcoin (BTC) May Follow the Downtrend
As shown in the daily chart, the Bitcoin price fails to stay above the 9-day moving average as it looks to set up another few days of negative price declines beneath $20,000. Meanwhile, a break above the opening price of $20,253 would have set the king coin up to reach the nearest resistance at the $21,000 level. In other words, traders can see Bitcoin fails to break up as the technical indicator Relative Strength Index (14) may cross into the oversold region.
However, the Bitcoin price couldn’t go higher as it is dropping towards the lower boundary of the channel. More so, should the technical indicator slide to the downside, the market price may end on the negative side. On the contrary, crossing above the 9-day and 21-day moving averages could hit the resistance levels at $28,000, $30,000, and $32,000.
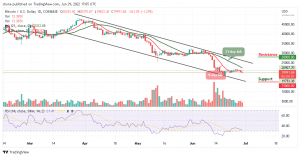
BTC/USD Medium-Term Trend: Ranging (4H Chart)
The 4-hour chart reveals that bulls may take time to come back into the market if they head towards the lower boundary of the channel. Therefore, if the bulls step back and push the coin above the upper boundary of the channel, the Bitcoin price may hit the resistance level of $23,000 and above.
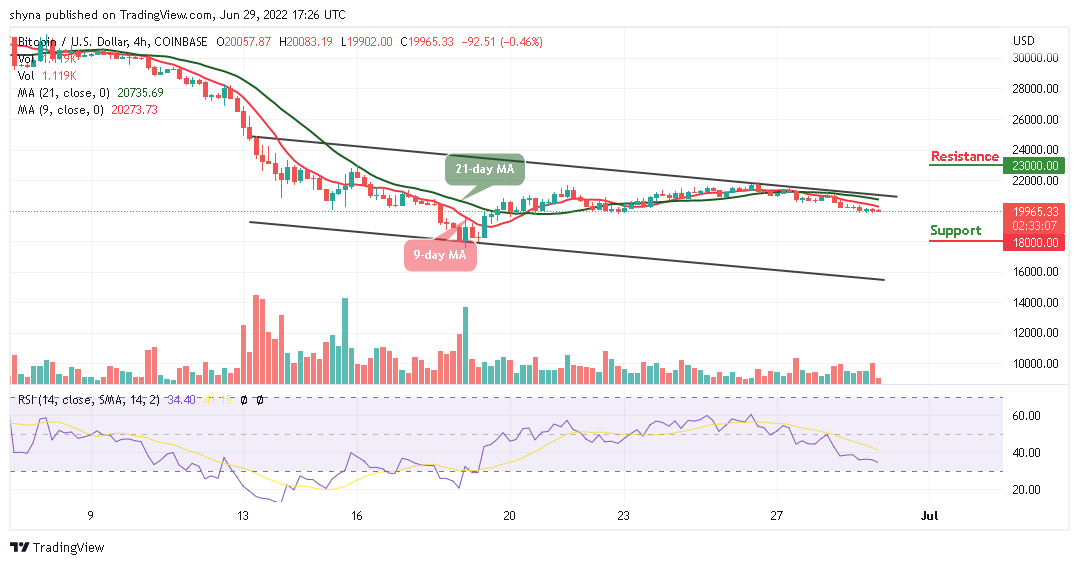
Nevertheless, if the sellers bring the current market value below the support level of $19,500, breaking this level may further allow the coin to hit the support at $18,000 and below. At the moment, the technical indicator Relative Strength Index (14) may likely cross below the 30-level to give additional bearish signals to the market.
Read more:
- How to buy Bitcoin
- How to buy Cryptocurrency
Join Our Telegram channel to stay up to date on breaking news coverage