

Join Our Telegram channel to stay up to date on breaking news coverage
Bitcoin (BTC) Price Prediction – April 18
Several times, the Bitcoin price has repeatedly failed to break above the critical $7,200 resistance level.
BTC/USD Long-term Trend: Bullish (Daily Chart)
Key levels:
Resistance Levels: $8,000, $8,200, $8,400
Support Levels: $6,000, $5,800, $5,600
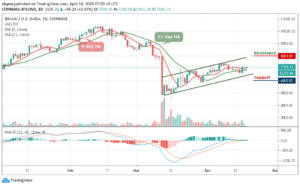
BTC/USD had a bullish start today as the price went up slightly from $7,035 to $7,135. In the process, the coin is still trading above the 9-day and 21-day moving averages. Over the past few days, the $7,200 resistance level has repeatedly prevented the buyers from moving ahead. Therefore, the bulls will need to conquer this level to continue and, more importantly, sustain the bullish momentum.
However, the $7,400 level is the next big resistance level the bulls may need to conquer, which could possibly trigger a significant uptrend in the nearest term. Actually, this may not be possible today because Saturday is usually an infamously slow day for BTC/USD. The coin may likely experience some consolidation before embarking on the next move.
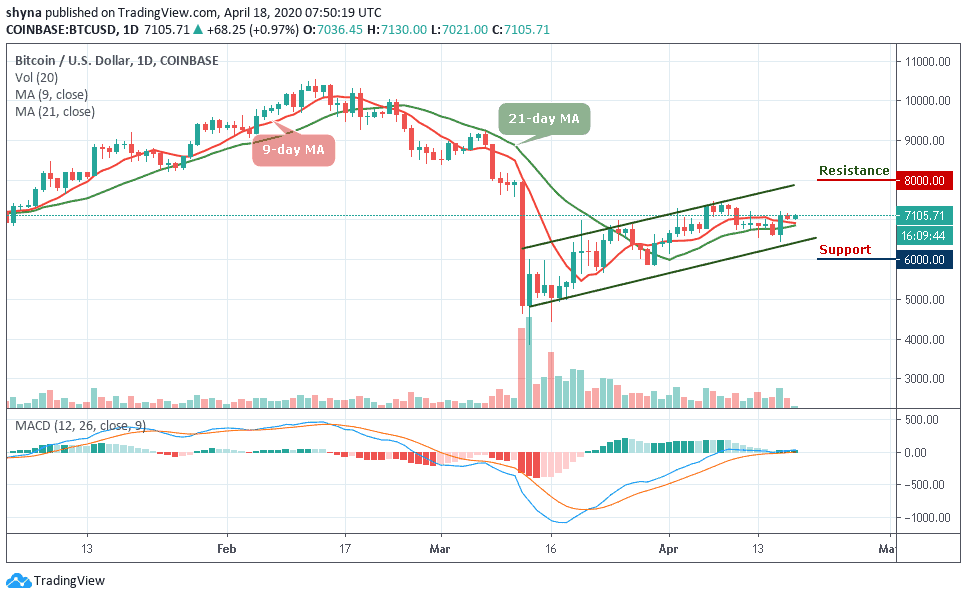
Furthermore, the market price for BTC/USD and the daily candle is trading at $7,105 and above the 9-day and 21-day moving averages. The next resistance level lies at $8,000, $8,200 and $8,400. However, if the Bitcoin price failed to extend its movement to the north; traders may experience a price cut to $6,700 vital support. A further low drive could send the price to $6,000, $5,800 and $5,600 supports.
For now, the market may likely move in sideways before forging ahead to the next direction. But with a look of things, the daily chart reveals that BTC/USD is rising as the MACD indicates increasing bullish momentum.
BTC/USD Medium-Term Trend: Ranging (4H Chart)
On the 4-Hour chart, BTC/USD trade in sideways. Nevertheless, the coin has not yet slipped below $6,900 and still in the loop of breaking above the channel. For now, BTC price hovers around $7,109 and may take time to persistently trade above this level as the upward movement may likely near the $7,400 and $7,600 resistance levels if the bulls regroup.
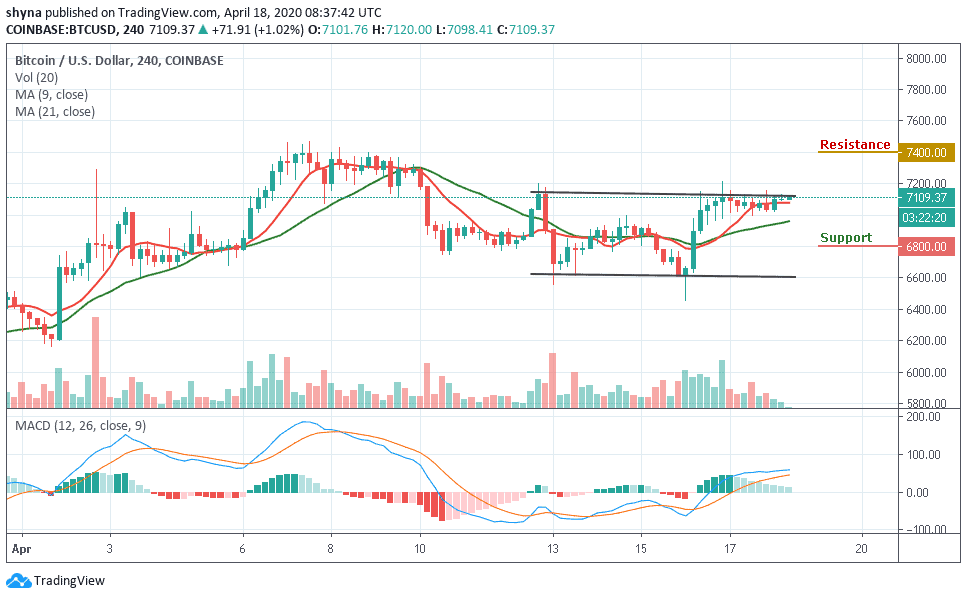
However, on the downside, immediate support is seen around the $6,900 level. The price may likely fall below the above-mentioned level if the bears step back into the market, a further bearish movement may reach another supports at $6,800 and $6,600 respectively. Meanwhile, the MACD signal lines have crossed into the positive side, which may likely give the buyers an upper hand in the market.
Please note: Insidebitcoins.com is not a financial advisor. Do your research before investing your funds in any financial asset or presented product or event. We are not responsible for your investing results.
Join Our Telegram channel to stay up to date on breaking news coverage
