Join Our Telegram channel to stay up to date on breaking news coverage
Bitcoin (BTC) Price Prediction – June 2
The Bitcoin price shot above $10,400 for the first time in more than three weeks.
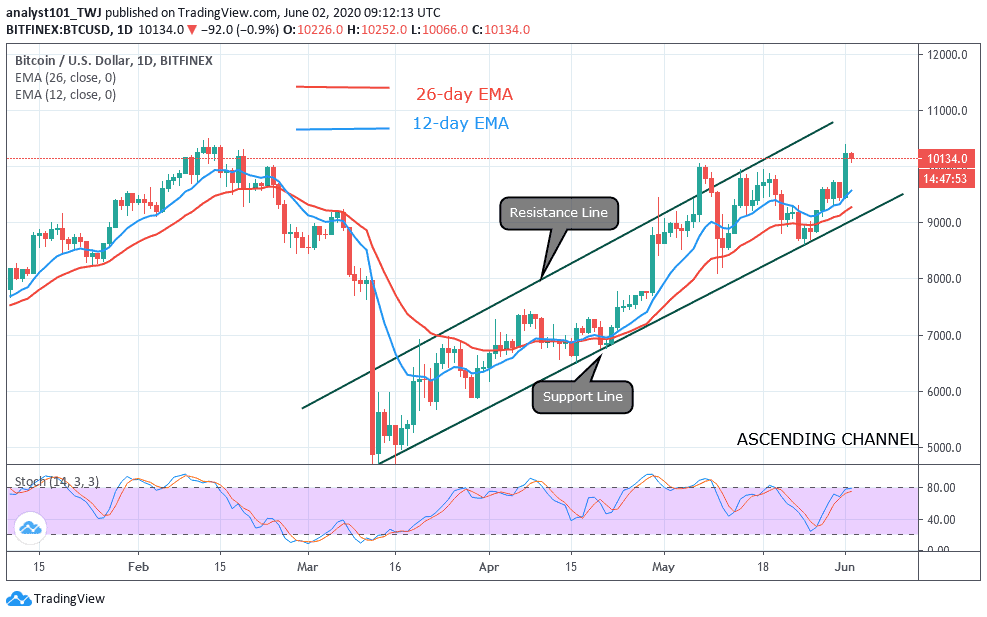
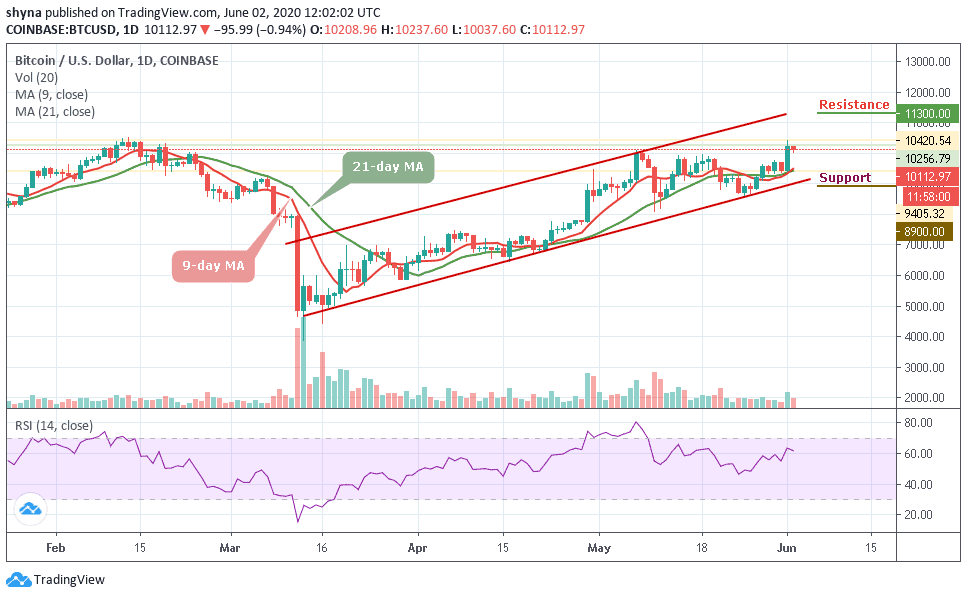
BTC/USD Long-term Trend: Bullish (Daily Chart)
Key levels:
Resistance Levels: $11,300, $11,500, $11,700
Support Levels: $8,900, $8,700, $8,500
BTC/USD shot above $10,000 for the first time since the first week of last month. A day before halving, Bitcoin dumped massively to levels close to $8,000. However, the recovery had been lethargic in the last two weeks, with resistance first at $9,000 and later at $9,700. Yesterday’s breakout above $10,000 paved the way for a flash rally to $10,420 which is June high. Meanwhile, in the last 12 hours, BTC/USD has retreated but defended the ground above $10,000.
Looking at the daily chart, BTC/USD is likely to continue with declines targeting $10,000 in the short term. To avert the losses buyers have a task to keep the price above $10,100 and even pull above $10,200. A step past $10,200 would encourage more buyers to join the market for another run towards $11,000. Meanwhile, the RSI retreating movement suggests sellers are gaining traction as the RSI (14) moves below 68-level.
Nevertheless, any failure by the bulls to move the price up, we may see a price cut to $9,500 vital support. A further low drive could send the price to $8,900, $8,700, and $8,500 supports. For now, the bulls are still dominating the market. But as things stand, the BTC/USD price may continue to follow the upward trend while the nearest resistance lies at $11,300, $11,500, and $11,700 levels.
BTC/USD Medium – Term Trend: Bearish (4H Chart)
Looking at the 4-hour chart, Bitcoin’s price is currently trading around $9,578 and below the 9-day and 21-day moving averages after falling from $10,242 where the coin touched today. From a technical point of view, the trend is in the hands of the sellers.
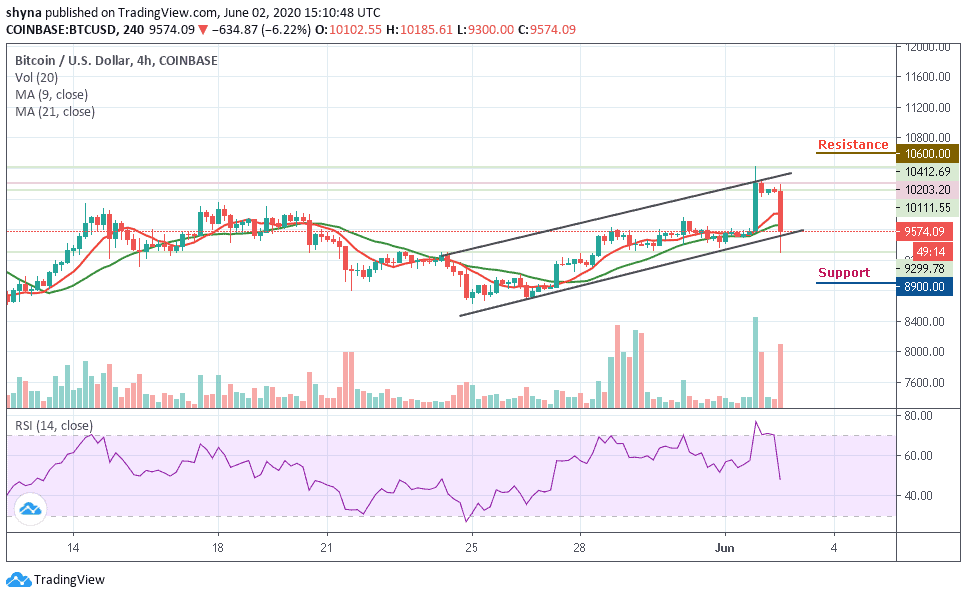
The technical indicator RSI (14) is retreating even though it had not reached the 40-level. As long as the downward trend continues, keeping Bitcoin above $9,500 will be a daunting task. In this case, it is best we look at possible support levels, starting at $8,900, $8,700, and $8,500. While the resistance lies at $10,600 and above.
Please note: Insidebitcoins.com is not a financial advisor. Do your research before investing your funds in any financial asset or presented product or event. We are not responsible for your investing results.
Join Our Telegram channel to stay up to date on breaking news coverage