Join Our Telegram channel to stay up to date on breaking news coverage
Bitcoin (BTC) Price Prediction – April 10
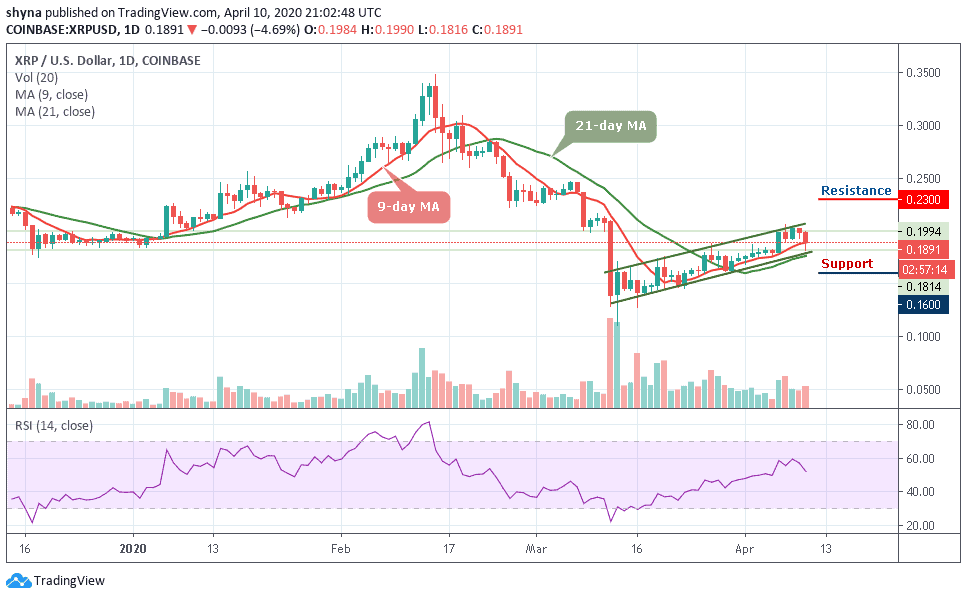
The Bitcoin (BTC) is likely to suffer more losses as it looks like the downside target of $6,500 is still in sight.
BTC/USD Long-term Trend: Bullish (Daily Chart)
Key levels:
Resistance Levels: $8,100, $8,300, $8,500
Support Levels: $5,900, $5,700, $5,500
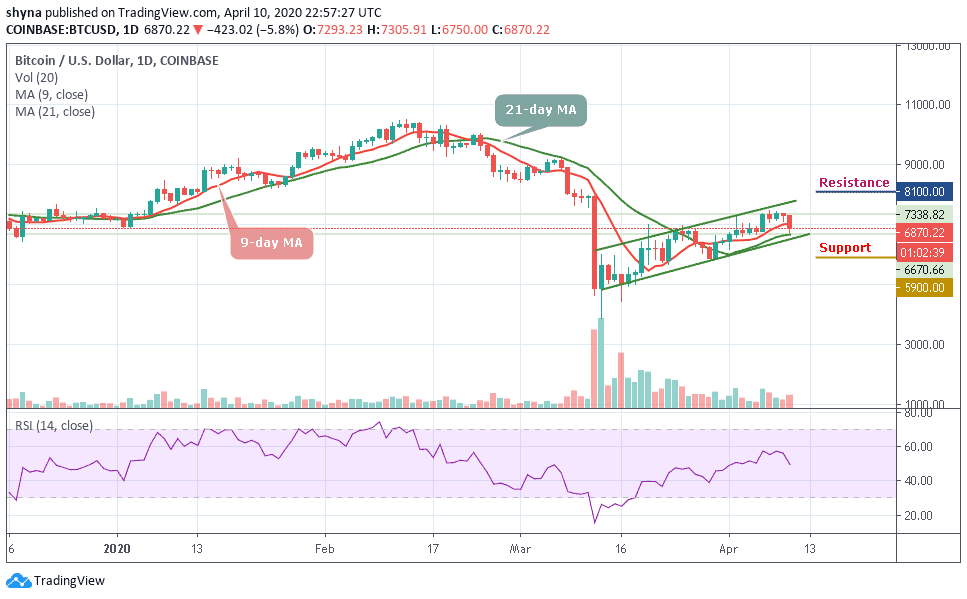
A couple of days ago, we saw a significant drop in the price of Bitcoin, lower than the $6,900 support against the US dollar. The BTC/USD pair found support close to $6,600 and corrected higher today. The coin climbed above the $6,600 level but couldn’t gain ground above the 9-day and 21-day moving averages where a peak was formed 3 days ago.
However, as a result of this, the price of Bitcoin began to fall further below the support level of $6,900 within the channel. As long as BTC stays above the support level of $6,500, a correction towards $7,200 is possible and after hitting it, the coin may likely visit the next resistance levels at $8,100, $8,300 and $8,500.
Conversely, if there is no recovery above the support level of $6,500, the price may continue to fall to support levels of $5,900, $5,700 and $5,500. Meanwhile, the technical picture looks bearish as RSI (14) faces level 50 pointing downwards, which indicates that the sell-off may continue.
BTC/USD Medium-Term Trend: Bearish (4H Chart)
Looking at the 4-Hour chart, the bears have now dominated the market by pushing the BTC/USD price below its support level that existed around $6,750. Although, the Bitcoin price has not yet slipped below $6,500 and it’s still in the loop of making a bounce back. Currently, the price of Bitcoin hovers around $6,874.50 and may take time to persistently trade above $7,000.
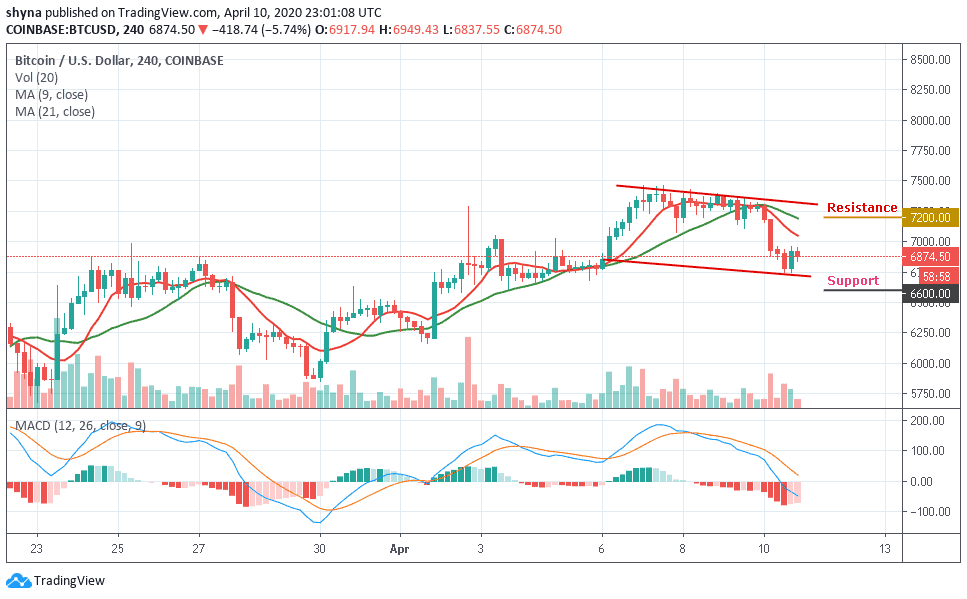
Furthermore, BTC/USD is currently moving below the 9-day and 21-day moving averages and any upward movement may likely push the price near the resistance levels of $7,200, $7,400 and $7,600 while the immediate support levels lie at $6,600, $6,400 and $6,200. The MACD is seen moving into the negative region while the decreasing negative divergence suggests that the bears may come into play.
Please note: Insidebitcoins.com is not a financial advisor. Do your research before investing your funds in any financial asset or presented product or event. We are not responsible for your investing results.
Join Our Telegram channel to stay up to date on breaking news coverage