

Join Our Telegram channel to stay up to date on breaking news coverage
Bitcoin (BTC) Price Prediction – June 19
After a move below $9,300, BTC/USD stays under pressure.
BTC/USD Long-term Trend: Bearish (Daily Chart)
Key levels:
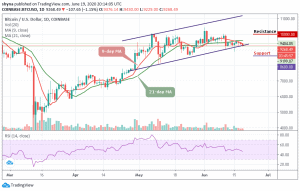
Resistance Levels: $10,000, $10,200, $10,400
Support Levels: $8,600, $8, 400, $8,200
BTC/USD is retreating below $9,300 after several unsuccessful attempts to engineer a bullish breakthrough above the upper boundary of the 9-day and 21-day moving averages. The first digital coin is losing around 1.15% of its value on a day-to-day basis and stays mostly unchanged since the beginning of today. Currently, BTC/USD is changing hands at $9,268, amid low short-term volatility.
Meanwhile, the market has remained in the consolidation mode below the moving averages, facing a downward trend. However, it can be expected that the market may continue to sell as soon as the declines come together. But if the bulls show a strong commitment, the king coin could rise to the potential resistance levels at $10,000, $10,200, and $10,400. The technical indicator RSI (14) is stylishly facing down but may soon be coming down.
Since a few days ago, BTC/USD has been trying to develop a recovery but failed to break out above the moving averages on the upside. With the look of things, the bears should be able to push the price below the lower boundary of the channel to increase the chances of a downward scenario which may lead the price to the supports of $8,600, $8,400, and $8,200 in the next downward period.
BTC/USD Medium – Term Trend: Bearish (4H Chart)
Looking at the 4-hour chart, Bitcoin’s price is currently trading around $9,291 and below the 9-day and 21-day moving averages after rebounding from the daily low of $9,244. However, the selling pressure still exists which leads the coin to lose the major support from the moving averages. Meanwhile, the $9,100 and below may come into play if BTC breaks below $9,200 support level.
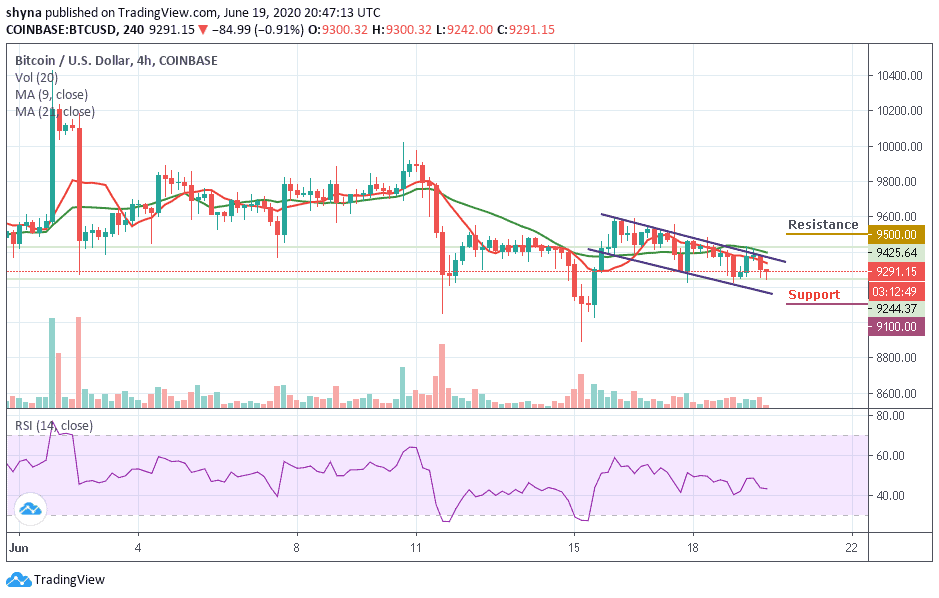
However, if the buyers can strengthen and energize the market, they can further push the price above the moving averages. Therefore, breaking this could also allow the bulls to test the $9,500 and above. Inversely, the RSI (14) is preparing to cross below 40-level and when this is done, the market price may be dragged to the support level of $9,100 and below.
Please note: Insidebitcoins.com is not a financial advisor. Do your research before investing your funds in any financial asset or presented product or event. We are not responsible for your investing results.
Join Our Telegram channel to stay up to date on breaking news coverage