Join Our Telegram channel to stay up to date on breaking news coverage
Bitcoin (BTC) Price Prediction – July 7, 2020
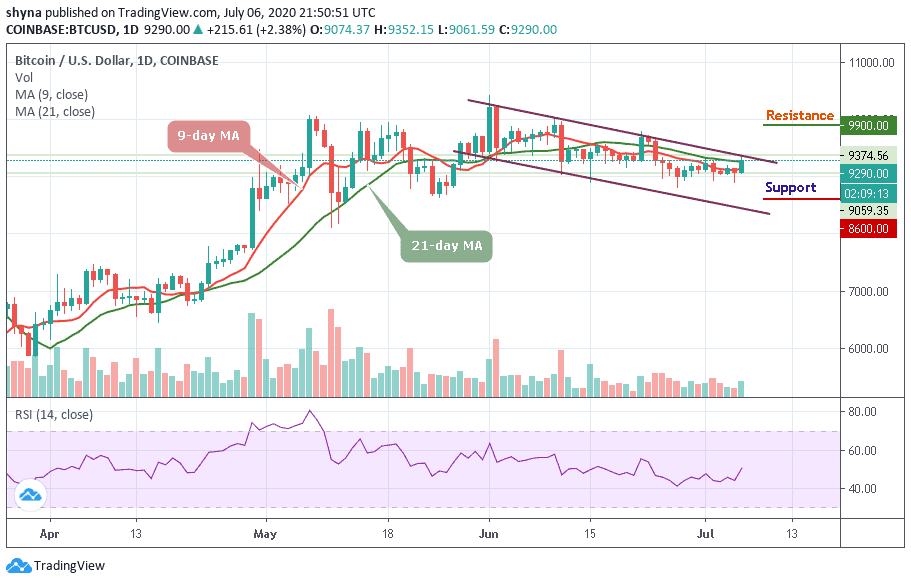
BTC/USD is now trading in a sideways trend between $9,000 and $9,300 since the last bearish impulse of June 27. The bulls have failed to break the $9,300 resistance to resume the upside range trading. The bears have also failed to break below $9,000 support as bulls continued to buy the dips.
Key Levels:
Resistance Levels: $10,000, $11, 000, $12,000
Support Levels: $7,000, $6,000, $5,000
In the last one week, Bitcoin bulls ‘buy the dips’ thrice as the bears attempted to break the $8,900 support. Nonetheless, if the bears have succeeded to break the $8,900 support, the coin would have fallen to $8825 low and later to $8,600. The market can sink to $8,130 low if the $8,600 cracks. However, buyers managed the selling pressure as they pushed the coin to the previous highs. The bulls on the other hand, failed to break the $9,300 resistance because of the presence of sellers defending the current resistance.
Once buyers overcome the $9,300 resistance, the upside range trading will commence. In upside range trading, price fluctuates between $9,300 and $9,800 to retest the $10,000 overhead resistance. In the meantime, the BTC has fallen to $9,289 after failing to break the $9,300 resistance. Bitcoin is at level 50 of the Relative Strength Index period 14. This implies that BTC is still in the bullish trend zone and it is likely to rise.
BTC/USD Medium-term Trend: Bullish (4-Hour Chart)
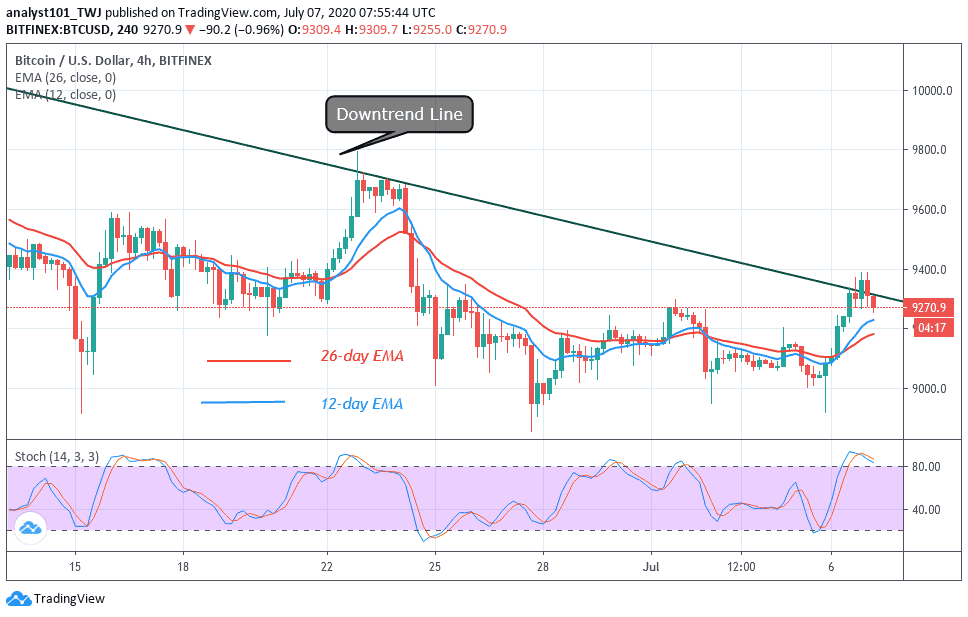
On the 4 hour chart, the bulls have a partial breaking of the downtrend line. That is the price broke the trend line but the upward move could not be sustained. Technically, if price breaks the trend line and closes above it, the price will continue to rise. In this case, the price is falling. Meanwhile, the coin is presently above 80 % range of the daily stochastic. It indicates that the market is in the overbought region. Sellers have already emerged as they pushed the BTC downward.
Join Our Telegram channel to stay up to date on breaking news coverage