Join Our Telegram channel to stay up to date on breaking news coverage
Bitcoin (BTC) Price Prediction – February 29
BTC/USD has been trading in a tight range. The price has been fluctuating between $8,400 and $8,800. The price action is characterized by small body candlesticks.
Key Levels:
Resistance Levels: $10,000, $11,000, $12000
Support Levels: $7000, $6000, $5000

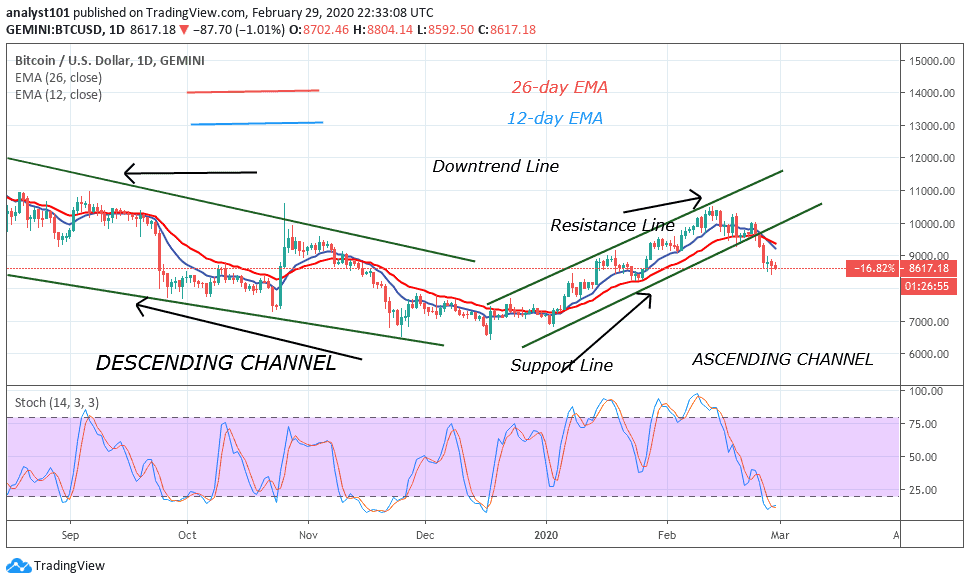
On February 27, Bitcoin fell to the low of $8,700 and resumed fluctuations. The price will rise from $8,400 to $8,800 and vice versa. This has been the situation for the past four days. It is worthy to note that the price action is characterized by small body candlesticks like Spinning tops and Doji candlesticks. These candlesticks describe the indecision between the buyers and sellers about the direction of the market. Meanwhile, the price is stuck between $8,400 and $8,800. In retrospect, Bitcoin was in consolidation in November 2019.
After a period of consolidation, BTC fell and followed the prevailing bearish trend. Nonetheless, BTC has fallen below 20% range of the daily stochastic. This implies that Bitcoin is in the oversold region of the market. Selling has been overdone. In the oversold region, buyers will be generated to push Bitcoin upward. The market will go up on the availability of buyers.
BTC/USD Medium-term Trend: Ranging (4-Hour Chart)
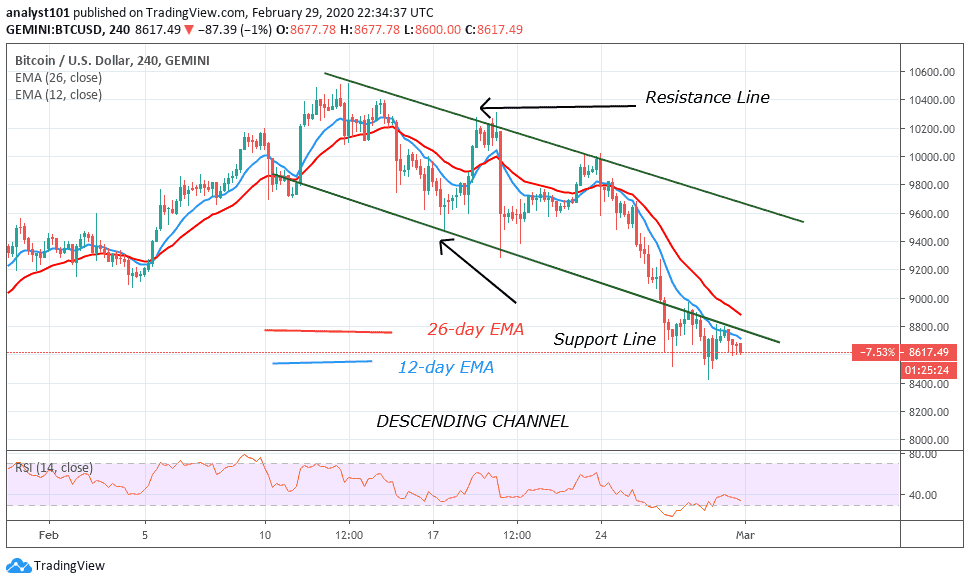
On the 4-hour chart, the market is characterized by small body candlesticks. At the current low the market moves up but is repelled by 12-day EMA.

The bottom line is that if the $8,400 cracks, the selling pressure will resume. It is most likely the coin will fall either to the low at $8,200 or $7,800. Meanwhile, Bitcoin has fallen to level 35 of the Relative Strength Index. This indicates that BTC is in the downtrend zone. The coin is likely to fall as it is below the centerline 50.
Please note: Insidebitcoins.com is not a financial advisor. Do your research before investing your funds in any financial asset or presented product or event. We are not responsible for your investing results.
Join Our Telegram channel to stay up to date on breaking news coverage

