Join Our Telegram channel to stay up to date on breaking news coverage
Bitcoin (BTC) Price Prediction – February 14
Looking at the daily chart, Bitcoin (BTC) price action is moving within a rising wedge structure but this could be a subject to a potential breakout to the downside.
BTC/USD Long-term Trend: Bullish (Daily Chart)
Key levels:
Resistance Levels: $11,200, $11,400, $11,600
Support Levels: $9,500, $9,300, $9,100
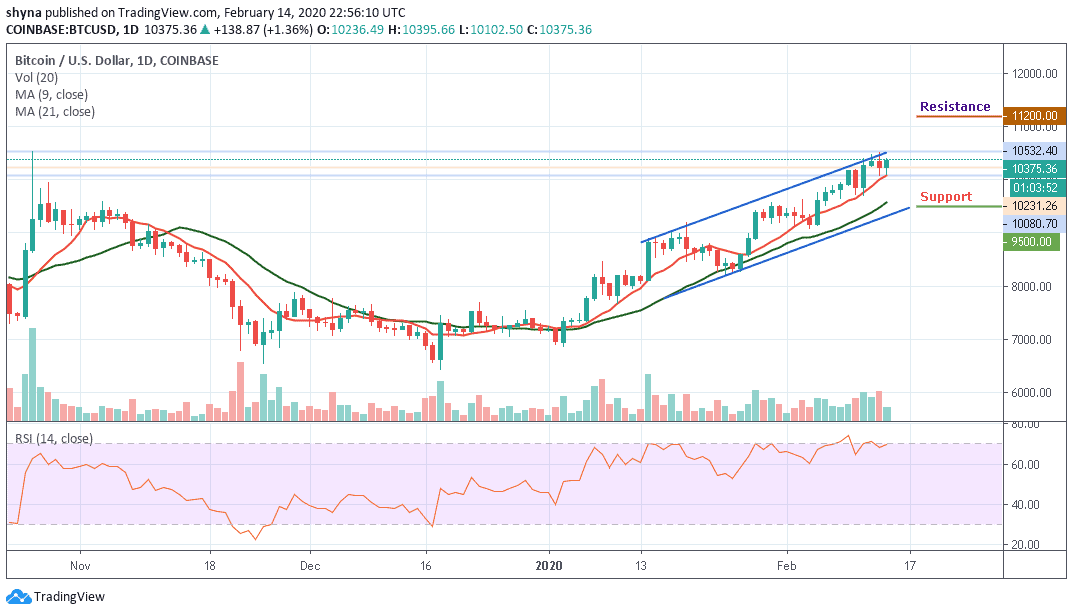
Last week, BTC/USD started trading at $9,760, and over the next three days, it was pumped up by 4.50% and added over $435 which got placed at $10,000 and above. A few days after, BTC corrected downwards by a 4.68% that took the price to a low at $9,704. From this low, Bitcoin (BTC) showed signs of strength, and the currency price was increased to $10,500, the highest point of the week.
More so, BTC couldn’t keep its value at this high for long, and over the last day of the week, it has lost close to 3% value, now trading at $10,375. Looking at the daily chart, BTC/USD is bracing for a jump to the resistance level of $11,000 but as it is now; the coin is seen moving between $10,080 to $10,532 resistance levels. Whether BTC/USD is going up or down depends on this range as the technical indicator RSI (14) is seen moving in sideways.
However, if the daily price can close above the current price of $10,375, a movement to $11,200, $11,400 and $11,600 resistance levels may likely come to play. In other words, if the daily price closes below $10,375, the coin might drop slightly crossing down below the 9-day moving average while the green line of 21-day MA may serve as the critical support at $9,500 for the coin but a break below this may lead to a further supports at $9,300 and $9,100 respectively.
BTC/USD Medium – Term Trend: Bullish (4H Chart)
Looking at the 4-hour chart, the price of Bitcoin is currently moving around $10,348 and above the 9-day and 21-day moving averages after a reversal from $10,107. Meanwhile, the hourly chart reveals that the bullish supply is coming up slowly in the market while the bears are also trying to drag the price down.
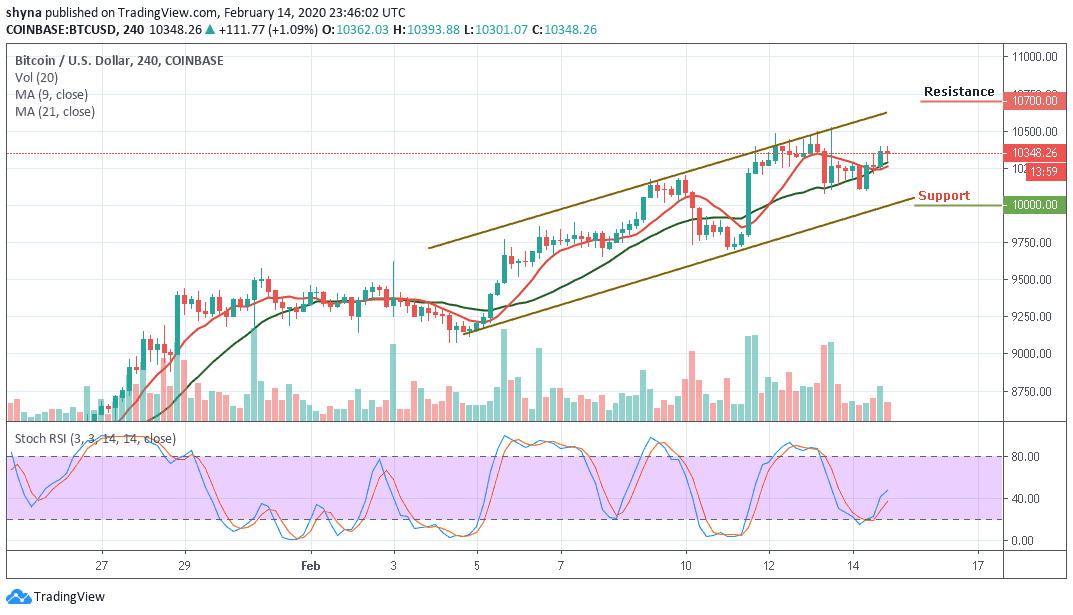
However, if the buyers could put more effort, they can further push the price to a $10,500 resistance level. Therefore, breaking the mentioned resistance could also test the $10,700 and above. More so, the stochastic RSI is seen moving around 40-level, but any movement towards the south may allow the sellers to step back into the market which could drag the price back to the support level of $10,000 and below.
Please note: Insidebitcoins.com is not a financial advisor. Do your research before investing your funds in any financial asset or presented product or event. We are not responsible for your investing results.
Join Our Telegram channel to stay up to date on breaking news coverage