Join Our Telegram channel to stay up to date on breaking news coverage
Bitcoin (BTC) Price Prediction – July 2, 2020
Bitcoin bulls have succeeded to push prices above $9,200 resistance as the market approaches the high of $9,300. However, as buyers attempt to push price to previous highs, there is a likelihood of facing resistance at $9,300 and $9,400. Perhaps, the upside range trading will resume when these levels are cleared.
Key Levels:
Resistance Levels: $10,000, $11, 000, $12,000
Support Levels: $7,000, $6,000, $5,000
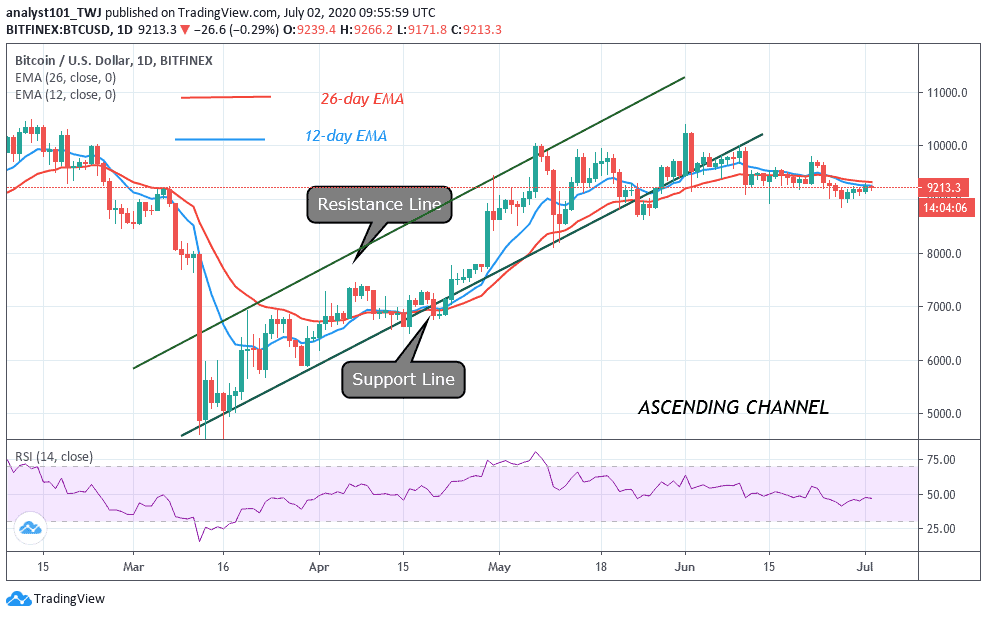
On July 1, BTC/USD rebounded above $9,150 to reach a high of $9,272. The coin was resisted as price dropped to $9,200 low. Analysts believe that the $9,000- $9,300 support must hold for the commencement of the upside range trading. In other words, if the $9,000- $9,200 support fails to hold, this is an indication of a downtrend. Bitcoin has left the upside range bracket and it is struggling in the lower region of $9,000. Traders believe that Bitcoin is exhausted and that a further downward move is imminent.
The king coin is falling after failing to push above the $9,300 resistance zone. On the downside, if the $9,000- $9,200 support fails to hold and price slumps below $9,000, a drop to $8,825 low is possible. The bearish momentum can continue to $8,638 and $8,130. In the meantime, the coin fell and found support above $9,200 to resume an upward move. On the upside, if the bulls clear the $9,300 and $9,400, BTC will resume upside range trading. The crypto is at level 47 of the Relative Strength Period 14. It indicates that the market is still in the downtrend zone and likely to fall.
BTC/USD Medium-term Trend: Bullish (4-Hour Chart)
On the 4 hour chart, BTC has been hovering above $9,100 for four days before the recent rebound. Buyers were repelled at the $9,300 resistance zone after the rebound.
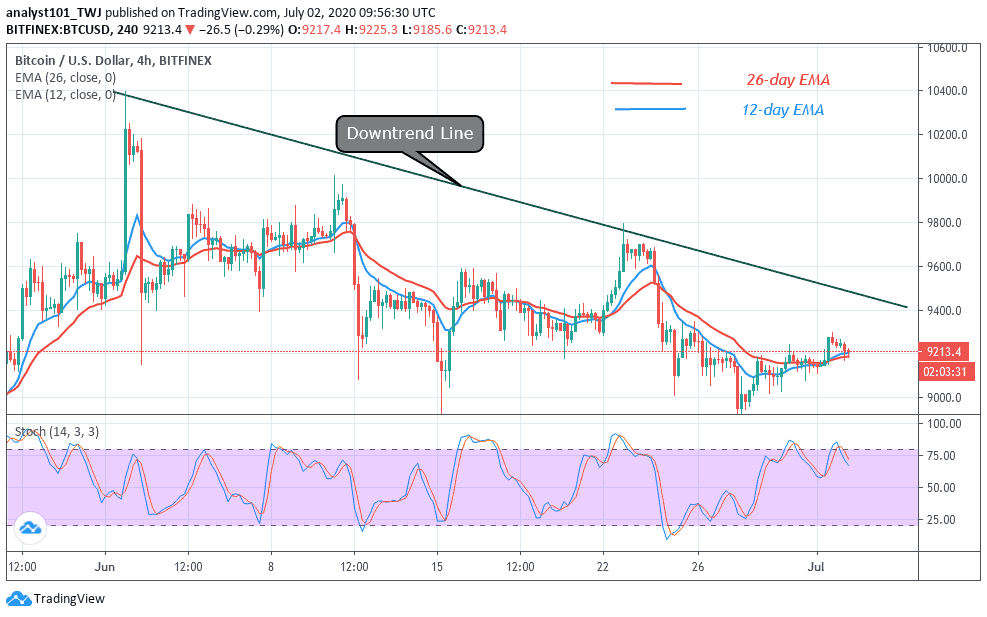
This explains the presence of sellers at the $9,300 resistance zone. Buyers are making a fresh uptrend after finding support above $9,200. On the upside, if the bulls fail to clear the current resistance, BTC will continue its sideways move or the downtrend will resume. Meanwhile, BTC is below 80% range of the daily stochastic. Presently, it is in a bearish momentum but the price action is indicating a bullish signal at the time of writing.
Join Our Telegram channel to stay up to date on breaking news coverage