Join Our Telegram channel to stay up to date on breaking news coverage
Bitcoin (BTC) Price Prediction – August 29, 2020
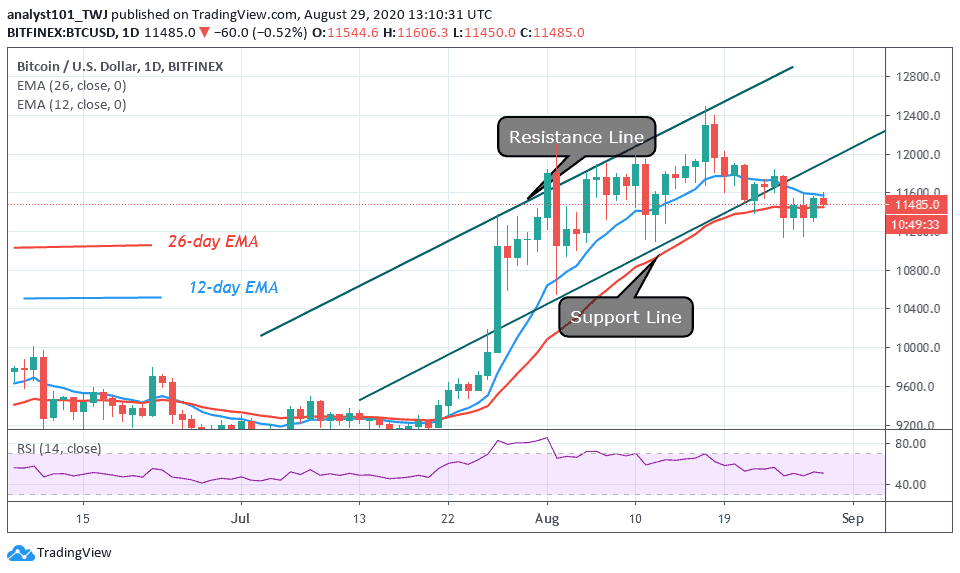
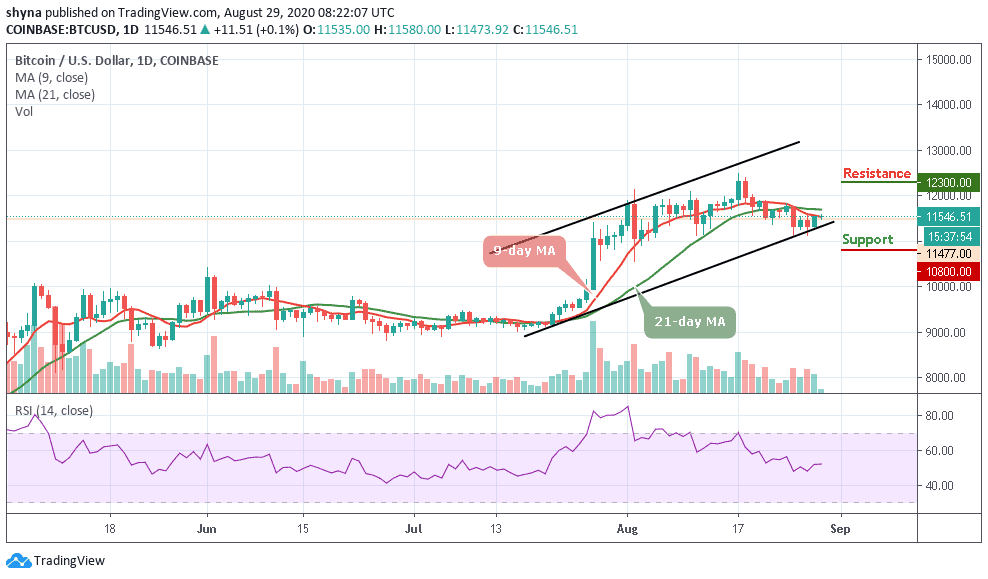
Bitcoin bulls have been able to curtail the bears above the $11,200 support for the past five days. Unfortunately, buyers were unable to push BTC above the $11,600 resistance. Today, BTC/USD is trading above $11,400, struggling to break the $11,600 resistance.
Resistance Levels: $10,000, $11, 000, $12,000
Support Levels: $7,000, $6,000, $5,000

For the past five days, the bears have been unable to break the $11,200 support. BTC will rebound above the $11,200 each time the bears attempt to break the current support. When the coin rebounds, price will rally to $11,600 resistance. The bulls have also been unable to break the recent high. The bottom line is that the market will continue to fluctuate until one of these levels is broken.
On the daily chart, the bulls are still struggling to push BTC above the EMAs or $11,600. Once this is achieved it becomes possible to retest or break the $11,800 and $12,000 resistance. On the hand other, as price fluctuates between $11,200 and $11,600, the bears may break the $11,200 and $11,000 support levels. If the bears are successful the market will slump to $10,400.
Bitcoin Faces Two Market Situation: A Rally to 16k or a Breakdown to $9.6K
According to reports, traders are debating whether BTC will first revisit the low of $9,600 or a rally to $16,000 high. Traders are articulating that BTC has been declining for some time. They are nervous because BTC may further decline if the $276 million CME Bitcoin futures expire on August 28.
Nonetheless, technical analysts believe that BTC is heading to either $16,000 or $9,600. That the direction is dependent upon certain resistance and support levels being hit. Some traders now agree that the chances of BTC rallying above $16,000 will increase if price is sustained above $11,500. On the other hand, if price remains below $10,500, BTC will first hit $9,600.

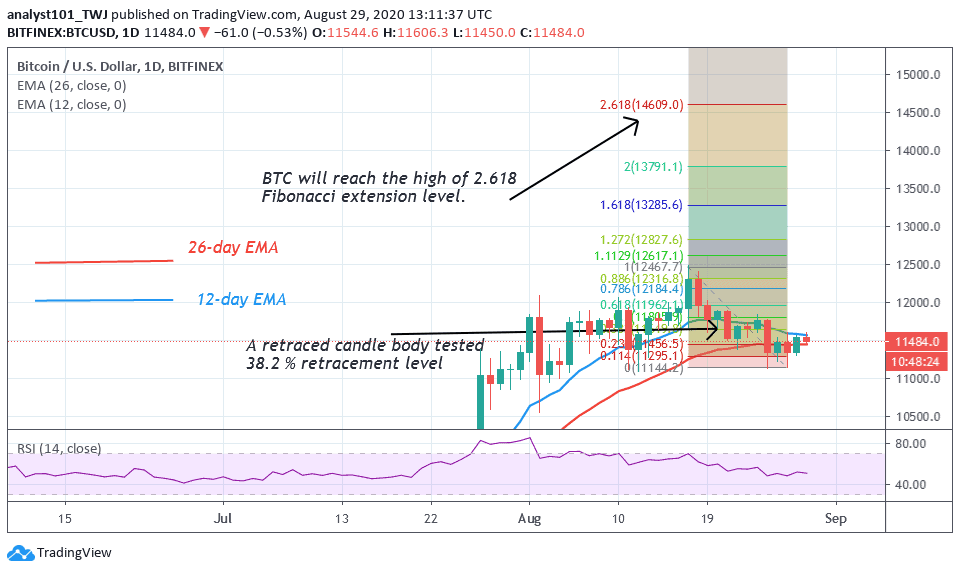
Nevertheless, BTC is falling after testing the $11,600 resistance. On August 17 uptrend, the king coin was resisted at the $12,400 resistance. The last retraced candle body tested the 38.2% Fibonacci retracement level. This indicates that Bitcoin will rise and reached a 2.618 Fibonacci extension level. That is the $14,500 high.
Join Our Telegram channel to stay up to date on breaking news coverage

