Join Our Telegram channel to stay up to date on breaking news coverage
ApeCoin is targeting $4.1 support level
APEUSD Price Analysis – October 06
Should APEApeCoin price go up above the resistance level at $5.9 and produce a bullish pattern, then upward movement could continue. A breakdown at the support level of $5.2 will expose ApeCoin to $4.7 and $4.1 support levels. Above the current price level are found resistance levels at $5.9, $4.7 and $4.1.
Key Levels:
Resistance levels: $5.9, $6.4, $7.5
Support levels: $5.2, $4.7, $4.1
APE/USD Long-term Trend: Bearish
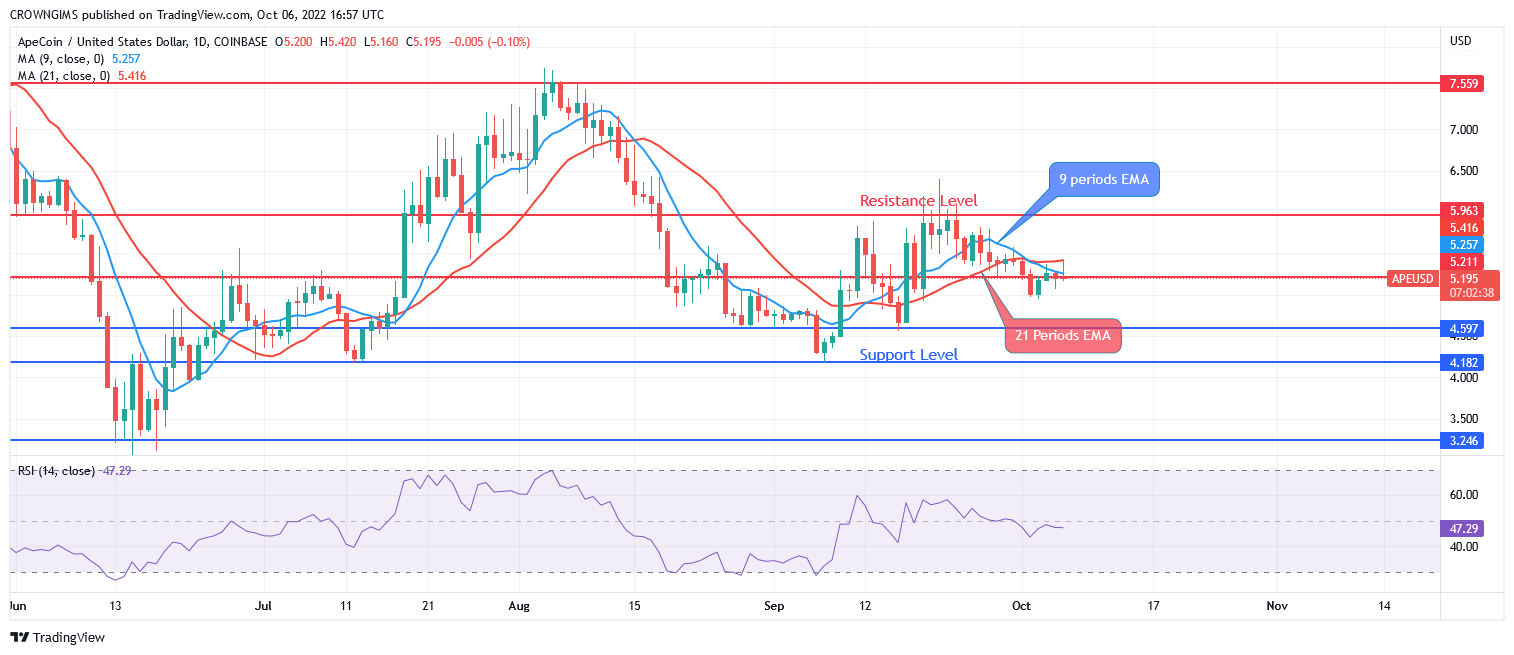
APE/USD is on the bearish movement in the daily chart. The support level of $4.1 was tested on September 06 and the bears’ momentum could not break down the mentioned level. A strong daily bullish candle emerges which make the bulls reacted against the bearish movement. This make the price increased to the resistance level of $5.9. The level was tested and price pulled back. ApeCoin may retest previous low at $4.1 level.

The Relative strength index Period 14 on the daily chart is at 47 level with the signal line pointing downwards which indicate a bearish signal. A breakdown at the support level of $5.2 will expose ApeCoin to $4.7 and $4.1 support levels. Above the current price level are found resistance levels at $5.9, $4.7 and $4.1.
Your capital is at risk
APE/USD Price Medium-term Trend: Bearish
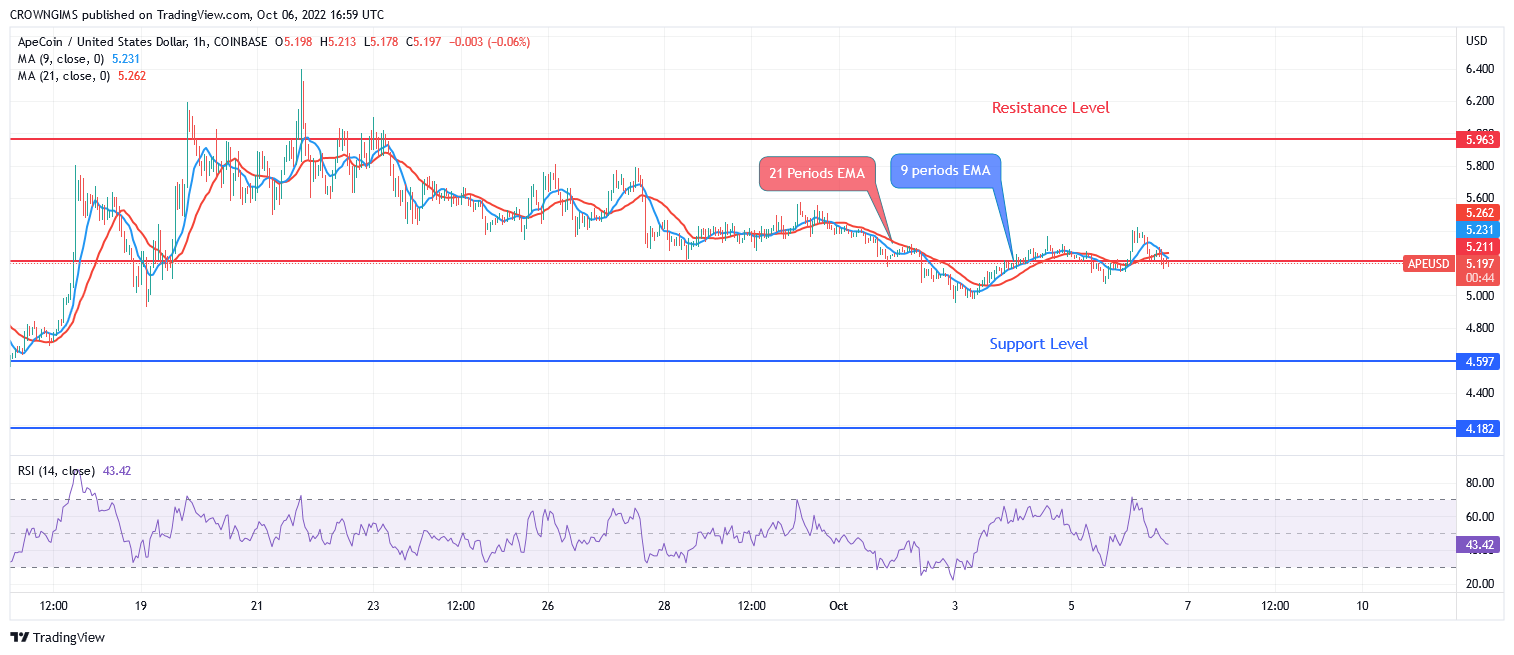
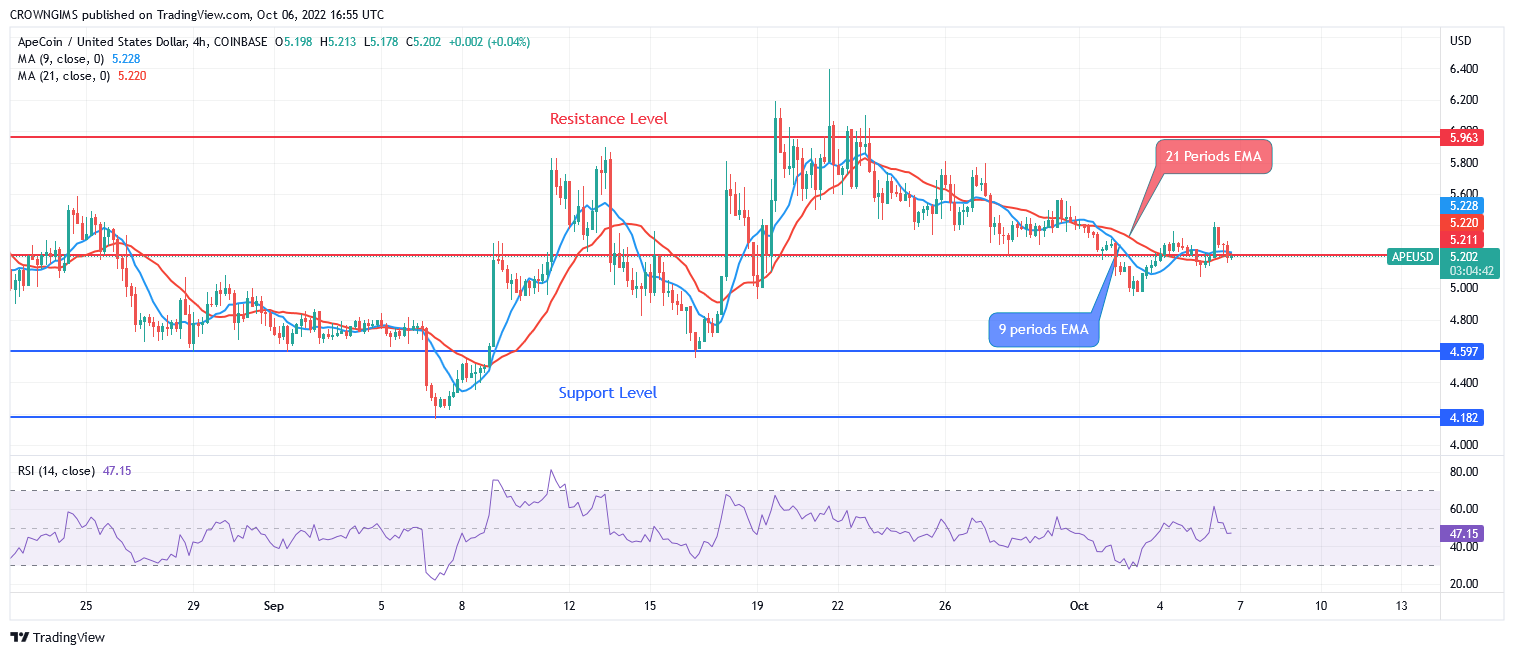
The ApeCoin is bearish on the medium-term outlook. More bearish candles were produced and the price reduced accordingly. The support level of $4.1 is tested but sellers have not enough pressure to penetrate the level downside. The price bounced up to retest the resistance level of $5.9. The price is currently retesting $5.2 level.
The 9-day EMA is interlocked with the 21-day EMA and the price is trading around the two EMAs, confirming low bullish momentum. Should ApeCoin price go up above the resistance level at $5.9 and produce a bullish pattern, then upward movement could continue.
Join Our Telegram channel to stay up to date on breaking news coverage


