Join Our Telegram channel to stay up to date on breaking news coverage
Lucky Block Price Prediction – May 11
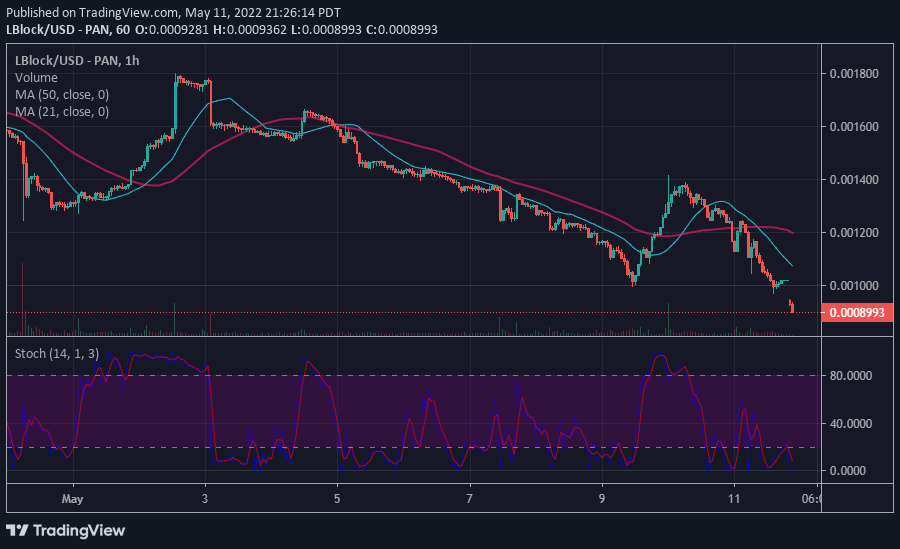
LBLOCK/USD is in a downtrend as it faces rejection at $0.001400. The selling pressure has continued despite the upward correction above the moving averages. This has been confirmed by the price indicator as the 21-day (blue line) moving average crosses below the 50-day (red line) moving average.
LBLOCK/USD Medium-term Trend: Ranging (1 hour chart)- as it Faces Rejection at $0.001400
Key Levels:
Resistance levels: $0.0016, $0.0018, $0.0020
Support levels: $0.0014, $0.0012, $0.0010

The LBlock price eased after the market declined to a low of $0.00100 on May 9. The bulls defended the current support as price rebounded to the previous highs. Buyers pushed the coin above the moving averages as it resumed upward correction. However, the upward correction was interrupted at the $0.001400 high. The bears sold at the recent high. LBLOCK/USD would have regained bullish momentum if the uptrend is sustained above the moving averages. Nonetheless, the bears pushed the coin to the previous low at $0.001000. Lucky block is likely to be compelled to a range-bound move between $0.001000 and $0.001400 price levels if the current support holds. Conversely, the downtrend will resume if the $0.001000 support is breached.
LBLOCK/USD Medium-term Trend: Bearish (15-Minute Chart)
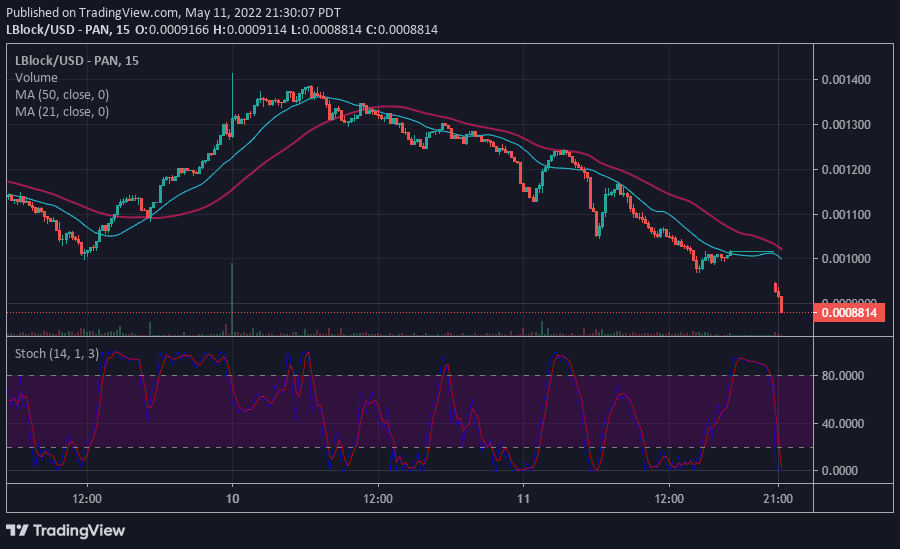
LBlock has continued to decline as it faces rejection at $0.001400. The market has declined to $0.0008049 low as of press time. The coin is below the 20% range of the daily stochastic. It implies the Lucky block is trading in the oversold region. In the oversold region, buyers are expected to emerge to push prices upward. On the upside, if buyers clear the $0.001400 high, the market will resume upside momentum.

You can purchase Lucky Block here. Buy LBlock:
Join Our Telegram channel to stay up to date on breaking news coverage

