Join Our Telegram channel to stay up to date on breaking news coverage
Ethereum Price Prediction – June 21
The Ethereum (ETH) loses 11.41% at the time of writing as the price goes below the $2000 level. The next target support may come at $1800.
ETH/USD Market
Key Levels:
Resistance levels: $2700, $2800, $2900
Support levels: $1400, $1300, $1200
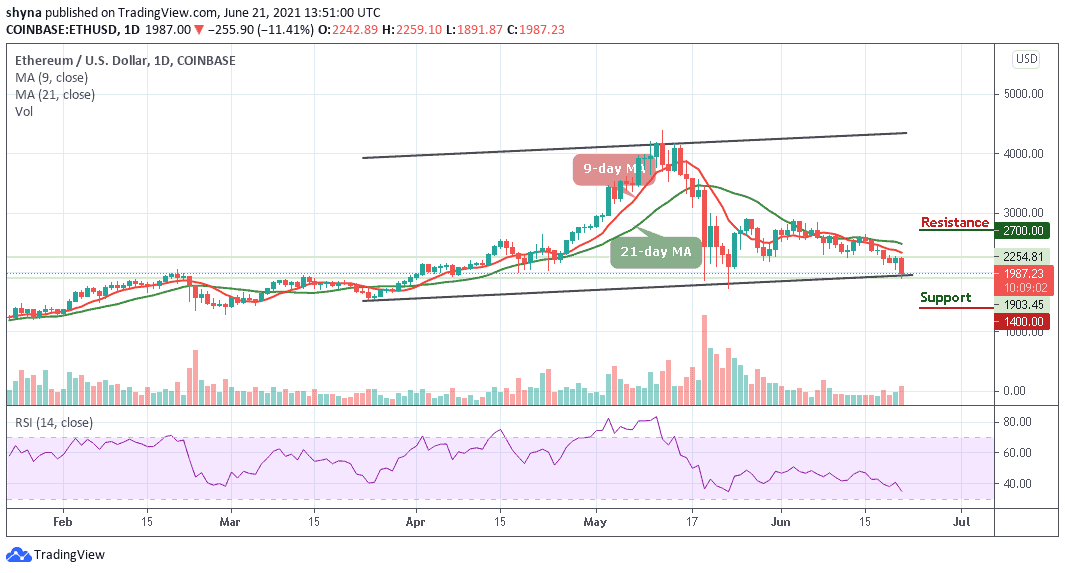
ETH/USD breaks below $2000 after an unsuccessful attempt to settle above $2300 handle during early Asian hours. At the time of writing, the Ethereum price is changing hands at $1987, down 11.41% after touching the daily high of $2259. For the past few days, bears have so far been pushing the market price below the 9-day and 21-day moving averages, hoping to revisit the critical $1750 support level.
Ethereum Price Prediction: Can $1800 Support Hold?
According to the daily chart, a break above the 9-day and 21-day moving averages could most likely give the Ethereum price a boost towards the important resistance of $2700, $2800, and $2900 levels. On the contrary, if the market focuses on the downside, the technical indicator Relative Strength Index (14) has a bearish feel after crossing below 40-level. Therefore, further bearish movement below the lower boundary of the channel could locate the first support at $1800.
However, Ethereum (ETH) could revisit $1750 support. Besides, the market price may keep moving downward as long as the red-line of the 9-day moving average is under the green-line of the 21-day moving average. Meanwhile, the critical support levels to keep eye on are $1400, $1300, and $1200 which are below the lower boundary of the channel.
When compares with Bitcoin, the Ethereum (ETH) is clearly bearish. As the price falls, sellers are posing an additional threat for buyers to reach the support level of 6000 SAT where the nearest target is located. However, an eventual break below the lower boundary of the channel may cause Ethereum to collapse more.
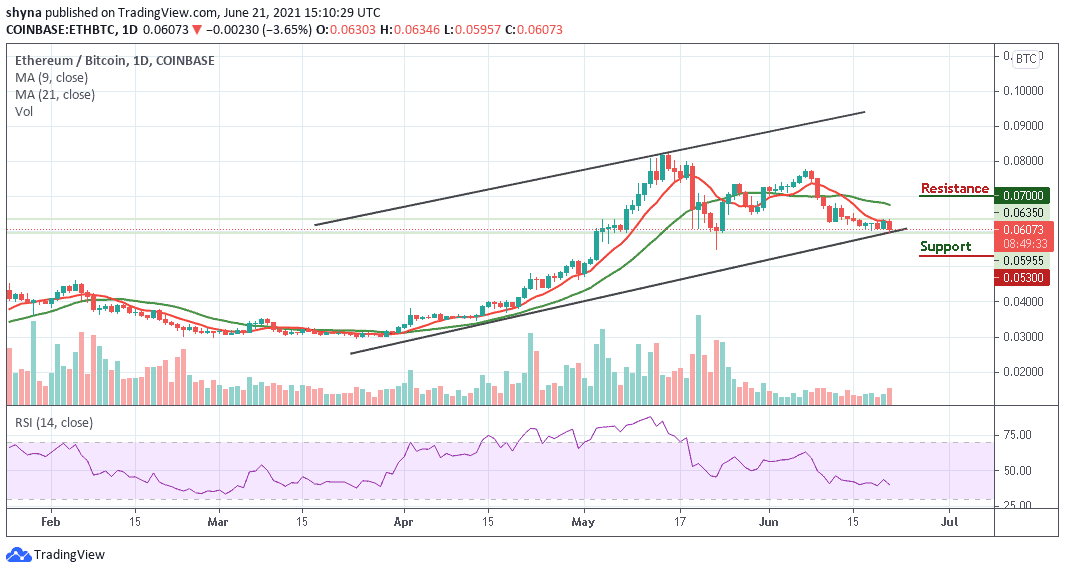
Meanwhile, the continuation of the downtrend below the 9-day and 21-day moving averages could hit the main support at 5300 SAT and below. Meanwhile, a bullish trend above the 9-day and 21-day MAs may likely push the market to the potential resistance at 7000 SAT and above. However, the technical indicator Relative Strength Index (14) confirms the bearish movement as the signal nosedives below the 45-level, suggesting that more bearish movements may play out.
Looking to buy or trade Ethereum (ETH) now? Invest at eToro!
75% of retail investor accounts lose money when trading CFDs with this provider
Join Our Telegram channel to stay up to date on breaking news coverage