Join Our Telegram channel to stay up to date on breaking news coverage
Ethereum Price Prediction – April 16
After the breakout of the key price level of $2,200 that occurred on the April 13 session, the market saw a light resistance near below the main immediate resistance trading line of $2,600 on April 15 and, that has now led the crypto-market to be on a little reversal move.
ETH/USD Market
Key Levels:
Resistance levels: $2,600, $2,800, $3,000
Support levels: $2,100, $1,900, $1.700
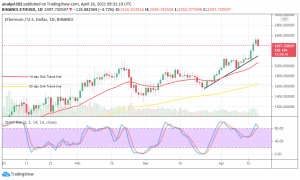
ETH/USD – Daily Chart
There has been an emergence of a fresh bearish candlestick to signal a start of other higher downward correctional move as price had lately approached the high line of $2,600. The 50-day SMA trend-line is still far below placed underneath the 14-day SMA trading indicator and the bullish trend-line. Both the smaller SMA and the bullish trend-line point to the north underneath the market’s current trading zone. The Stochastic Oscillators have closed the hairs around range 80 closely from the overbought region. That signals a resumption of a downward price move.
Will ETH/USD market revisit a low value around the $2,200 level?
It would be technically ideal for price to get retraced towards around the level of $2,200 so that the ETH/USD bulls easily find support to be able to re-launch their trading stance in continuation of the present bullish trend. A further slight downward push may cause the crypto-trade to locate a sit between the level earlier mentioned and the $2,000 point afterward.
With the current space of a downward move, bears may have to put more pressure to get the market’s advantage. As of writing the selling pressures has the brighter chance of seeing the crypto’s value dropped to some lower points. Meanwhile, the level of $2,200 remains the immediate critical support zone that bears may face the risk of getting their stance burnt if necessary precautionary placing of a sell order isn’t adhered to especially during a more active trading session.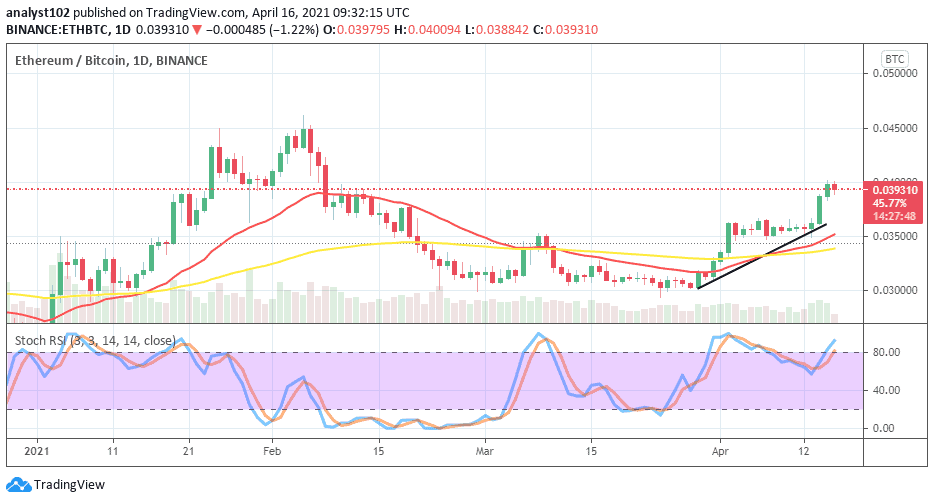
ETH/BTC Price Analysis
It shows on the trading chart that the base crypto is in a manner of putting more effort to push against the trading worth of the counter crypto in comparison. However, taking a broader look at the chart presently, BTC as a trading instrument still has a higher record of value than the base trading tool is yet to match. The 14-day SMA trend-line and the bullish trend-line with the 50-day SMA indicator are all closely featured below the point at which ETH has been able to push against BTC. The Stochastic Oscillators have crossed the hairs from below range 80 into the overbought region pointing towards the north. That suggests that the base crypto’s purchasing power is on a higher energy-increasing mode.
Join Our Telegram channel to stay up to date on breaking news coverage