

Join Our Telegram channel to stay up to date on breaking news coverage
Bitcoin (BTC) Price Prediction – July 15
Traders may see a more severe decline in the next couple of days if the bearish trend continues to shape in a pattern formation.
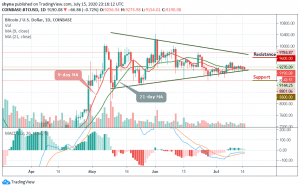
BTC/USD Long-term Trend: Ranging (Daily Chart)
Key levels:
Resistance Levels: $9,600, $9,800, $10,000
Support Levels: $8,800, $8,600, $8,400
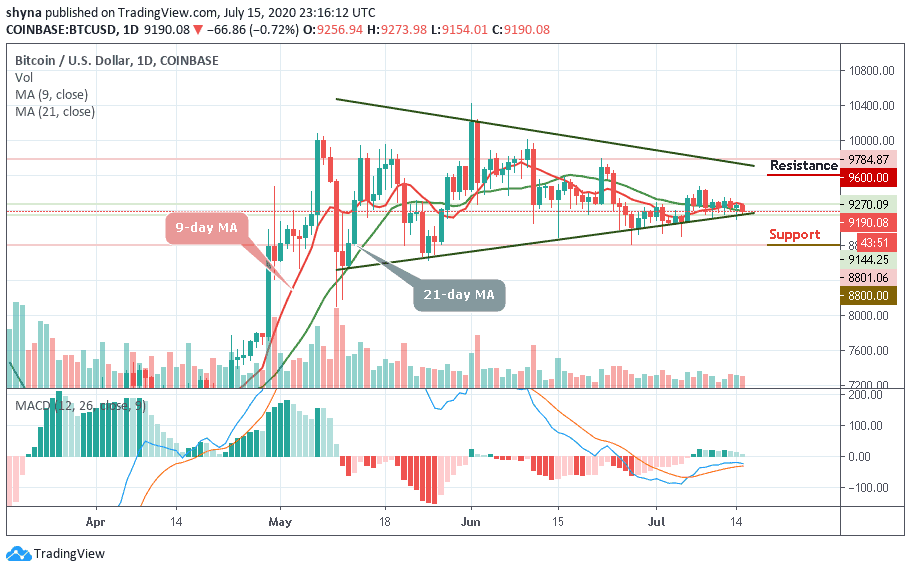
At the time of writing, BTC/USD is trading down marginally at its current price of $9,190. This is around where it has been hovering throughout the last week. Actually, buyers have attempted to propel it higher on multiple occasions, each one was met with significant selling pressure around $8,800. The technical indicator MACD is still reflecting an ongoing bearish action in the market as Bitcoin remains in the negative zone. A positive cross should provide a buying opportunity.
Meanwhile, the market is currently following a sideways movement and this unrelenting sideways movement trading is unlikely to last for too much longer. For the past few weeks, the market has remained in a consolidation mode, deciding on the next actual move. However, we can expect the market to continue to sell as soon as the bears regroup. In case the bulls show strong commitment, Bitcoin may climb back to the potential resistance levels.
While BTC/USD pair consolidates at around the 9-day and 21-day moving averages, the price may fall back at the $9,000 holding support before slipping further to $8,800 support. Driving beneath this support could plummet the price at $8,600 support and $8,400. On the other hand, a quick retracement may allow the price to retest the $9,600, $9,800, and $10,000 resistance. Still, Bitcoin remains ranging at the moment.
BTC/USD Medium-Term Trend: Ranging (4H Chart)
BTC/USD is still trading around $9,198 after touching $9,273 in the early hours of today. Looking at the hourly price chart, we can see that the bearish supply is coming in the market slowly, but the bulls are also trying to defend the $9,200 supports. Meanwhile, the $9,050 support level and below may come into play if BTC breaks the mentioned support.
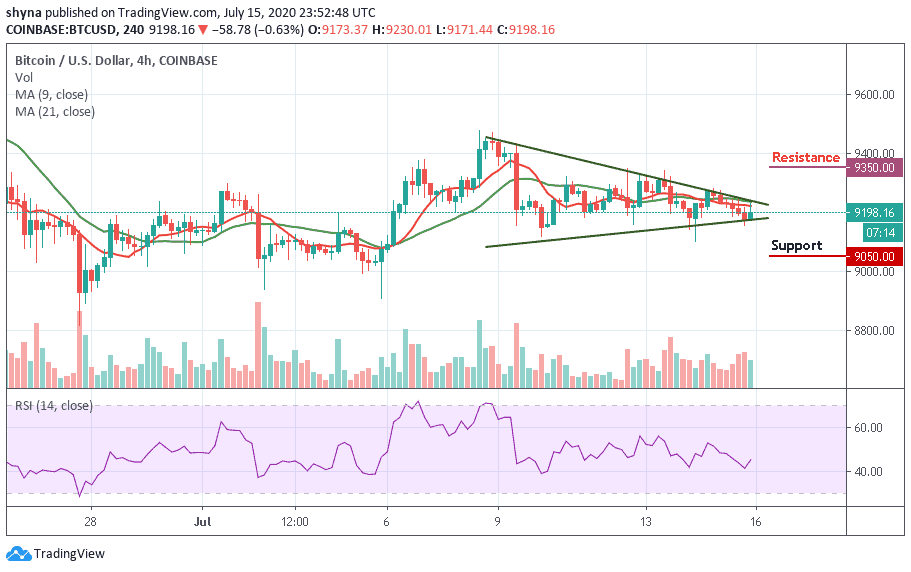
However, if the bulls regroup, we can expect a retest of $9,300 resistance level. Therefore, breaking the mentioned resistance could also allow the bulls to test the $9,350 and above. However, BTC/USD is consolidating and moving in sideways on the medium-term outlook.
Join Our Telegram channel to stay up to date on breaking news coverage
