Join Our Telegram channel to stay up to date on breaking news coverage
Bitcoin (BTC) Price Prediction – April 30
BTC/USD has reversed the gains of the day amid sharp sell-off. The coin needs to regain ground above $9,000.
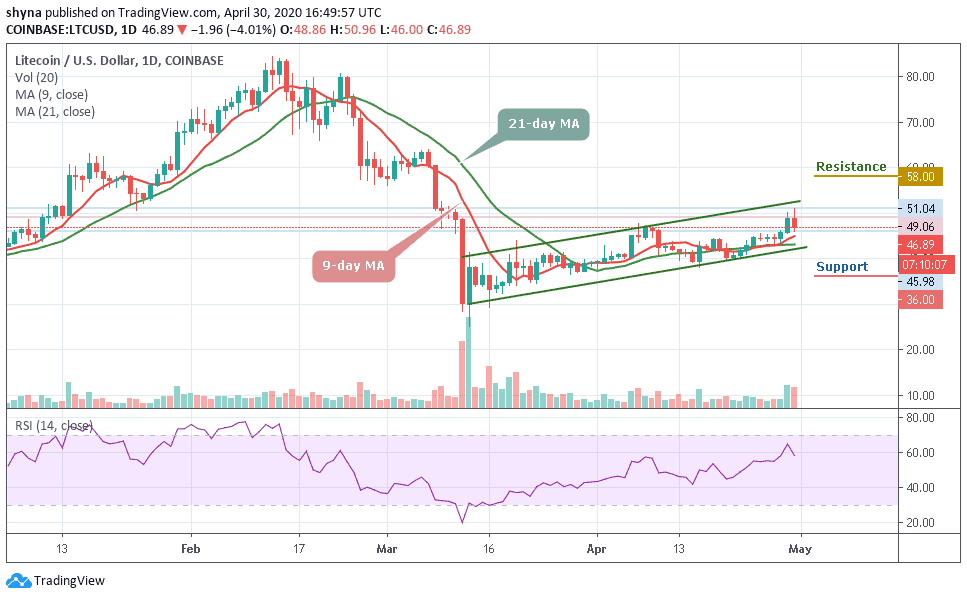
BTC/USD Long-term Trend: Bullish (Daily Chart)
Key levels:
Resistance Levels: $10,000, $10,200, $10,400
Support Levels: $7,400, $7,200, $7,000

The daily chart reveals that BTC/USD dropped from the intraday $9,487 to $8,396. The first digital coin lost nearly $1000 in a matter of hours before recovering to $8,603 at the time of writing. More so, a sustainable move below $8,000 may create a strong bearish momentum; however, the coin is heavily bought on the dips. Looking at the daily chart, the technical indicator has signaled that the downside correction may be underway.
However, once the price move below the psychological barrier $8,000, the sell-off pressure may increase and could drag the price towards $7,500 where the new sellers may emerge. On the downside, the next support may come at the intraday low $7,400, further bearish movement may be at $7,200 and $7,000 support levels as the technical indicator RSI (14) prepares to leave the overbought zone by crossing below 70-level.
Meanwhile, if the bulls can regroup and energize the market, the coin may continue the uptrend by retouching the nearest resistance at $9,000. Any further bullish movement could also push to it the potential resistance levels of $10,000, $10,200, and $10,400 respectively.
BTC/USD Medium-Term Trend: Bullish (4H Chart)
At the opening of the market today, the Bitcoin price first went up to touch $9,485 but has dropped to $8,405 within 24 hours, taking its price to where it is currently trading at $8,655. In addition, if the price continues to drop further and move below the moving averages, it could reach the nearest support levels at $7,800 and below.
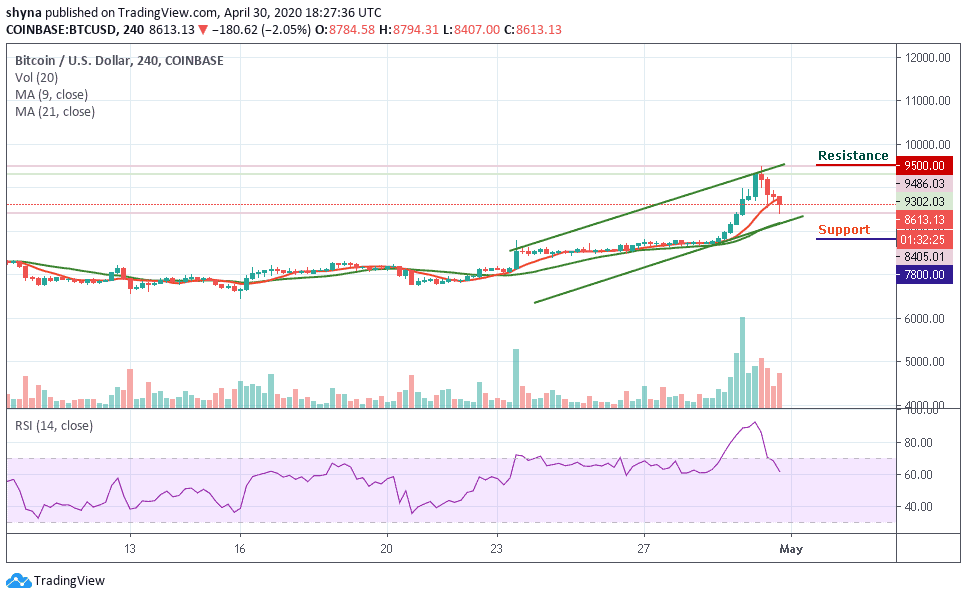
Moreover, if the bulls gather more strength and push the coin above the upper boundary of the channel, BTC/USD may likely reach the potential resistance levels of $9,500 and above. Presently, the market may follow the downward trend as the RSI (14) indicator nosedives below 65-level.
Please note: Insidebitcoins.com is not a financial advisor. Do your research before investing your funds in any financial asset or presented product or event. We are not responsible for your investing results.
Join Our Telegram channel to stay up to date on breaking news coverage