Join Our Telegram channel to stay up to date on breaking news coverage
Bitcoin (BTC) Price Prediction – March 23
BTC/USD is trading around $6,300 and it is likely to climb steadily with a few downward moves.
BTC/USD Long-term Trend: Bullish (Daily Chart)
Key levels:
Resistance Levels: $7,700, $7,900, $8,100
Support Levels: $5,000, $4,800, $4,600

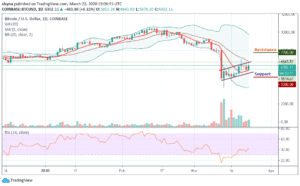
On the daily chart, we can see that BTC/USD has rapidly declined to result in price dropping $1,000 within the space of a few days. Since then, short-term price action has formed a wedge that has clearly broken to the upside. This has resulted in price levels attempting to form a new uptrend. Buying volume has yet to flood back into the market and will be required in order to sustain any form of a new uptrend.
Currently, the market price for BTC/USD and the daily candle is trading at $6,302 but has already moved above the 9-day moving average. The next resistance levels lies at $7,700, $7,900 and $8,100. Typically when the new uptrends are beginning to form, traders will use the middle limit of the Bollinger bands as a pivot resistance point to gauge the strength of the trend. When price levels rise above this, it is a sign of sustainability and will likely result in a continuation of the newly formed trend.
However, should BTC price failed to move up; we may see a price cut to $5,500 vital support. Any further movement could send the price to $5,000, $4,800 and $4,600 supports. At the moment, the daily chart reveals that the bulls are still defending critical support. But as things stand, BTC/USD is rising while the technical indicator RSI (14) is also moving above 40-level.
BTC/USD Medium-Term Trend: Ranging (4H Chart)
Following today’s bounce, Bitcoin’s price was roofed at $6,625 resistance after breaking the wedge pattern bullishly to the upside on the 4-hour chart. The resistance at the $6,625 was too heavy for the bulls to overcome. So the price is seriously struggling in a consolidation mode, which has made BTC remain indecisive over the past few hours now. The resistance levels to watch are 6,800 and above.
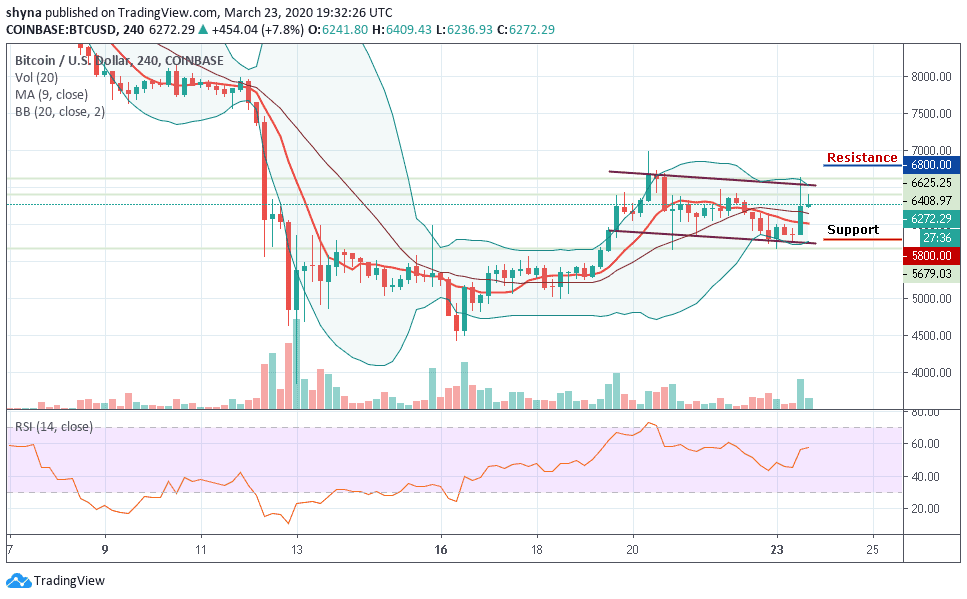
In addition, Bitcoin’s price is still roaming around the $6,272 and we can see that the bullish supply has been slowly coming up in the market as they are trying to defend the $6,000 support. Meanwhile, the $5,800 and below may come into play if BTC breaks the mentioned support. There’s hope for the buyers as soon as the RSI (14) begins to follow the upward trend.
Please note: Insidebitcoins.com is not a financial advisor. Do your research before investing your funds in any financial asset or presented product or event. We are not responsible for your investing results.
Join Our Telegram channel to stay up to date on breaking news coverage