Join Our Telegram channel to stay up to date on breaking news coverage
XRP Price Prediction – February 14
Today, the Ripple (XRP) price is trading in the positive territory, with gains of over 1.95%.
XRP/USD Market
Key Levels:
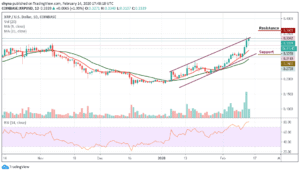
Resistance levels: $0.36, $0.37, $0.38
Support levels: $0.28, $0.27, $0.26
Today, XRP/USD jumped from $0.325 to the area above $0.330 in a matter of hours and touched an intraday high at $0.33 after the coin has reverted to $0.311 before a rebound came into focus, the pair retains bullish momentum. In the short term, XRP/USD has gained more than 1.95% within 24 hours and currently trading above the 9-day and 21-day moving averages.
Meanwhile, due to a strong upside movement of the coin, Ripple’s XRP broke free from the recent range on February 12 and tested the highest level. The 9-day moving average at $0.293 now serves as strong support for the coin. If it is broken, the sell-off may be extended to $0.28, $0.27 and $0.26 support levels.
Moreover, the technical indicator RSI (14) is extremely with the overbought condition facing the north and giving more bullish signals. Similarly, if XRP/USD manages to break out of the channel and climb above $0.350, the market may fuel a bull run to $0.36, $0.37, $0.38 resistance levels. As it stands now, the bulls appeared to be gaining control over a long-term outlook.
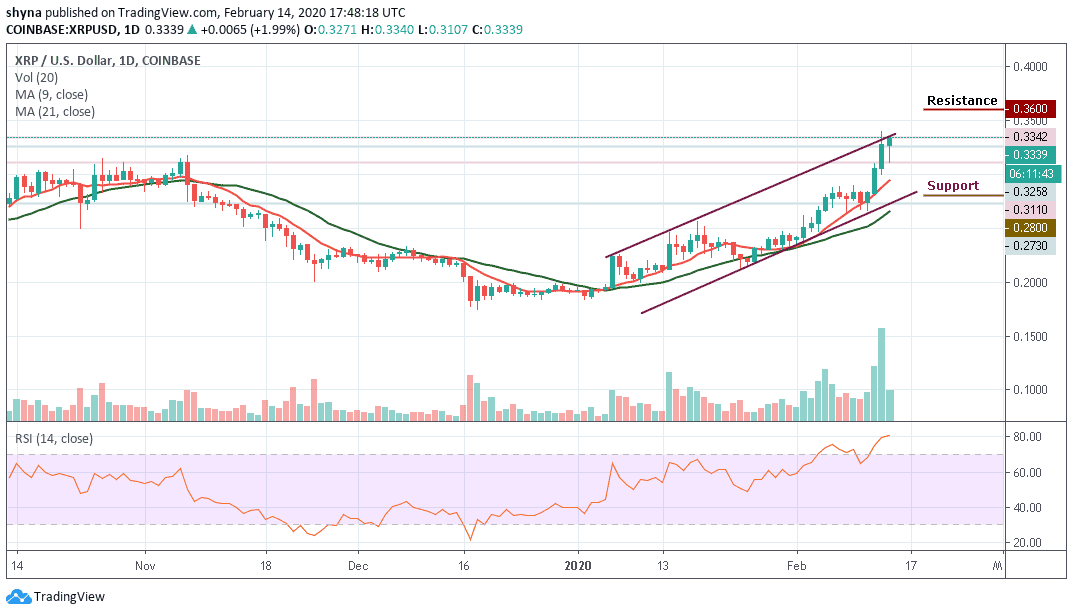
When compared with Bitcoin, Ripple (XRP) is seen demonstrating some positive signs across the market. Actually, the trend is perpetually looking bullish in the long-term while crossing the upper boundary of the ascending channel. XRP/BTC is currently changing hands at 3248 SAT after witnessing some bearish movement some days ago.
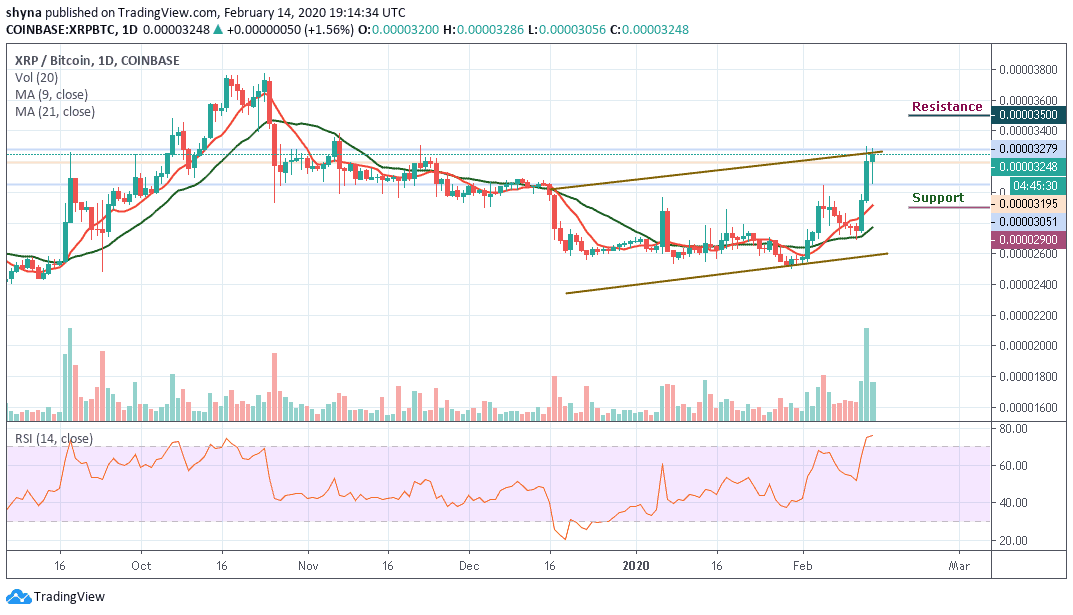
Meanwhile, the resistance levels to look for are 3500 SAT, 3600 SAT and 3700 SAT while the closest support levels to keep an eye on are 2900 SAT, 2800 SAT, and critically 2700 SAT. The technical indicator RSI (14) moves into the overbought zone to confirm the bullish movement.
Please note: Insidebitcoins.com is not a financial advisor. Do your research before investing your funds in any financial asset or presented product or event. We are not responsible for your investing results.
Join Our Telegram channel to stay up to date on breaking news coverage