
Join Our Telegram channel to stay up to date on breaking news coverage
In a recent video, well-known YouTuber Steve from Crypto Crew University discusses the Pi Cycle Top Indicator and its implications on the crypto market movements. This indicator has gained attention due to its historical accuracy in predicting the peaks of Bitcoin’s market cycles.
Understanding the Pi Cycle Top Indicator
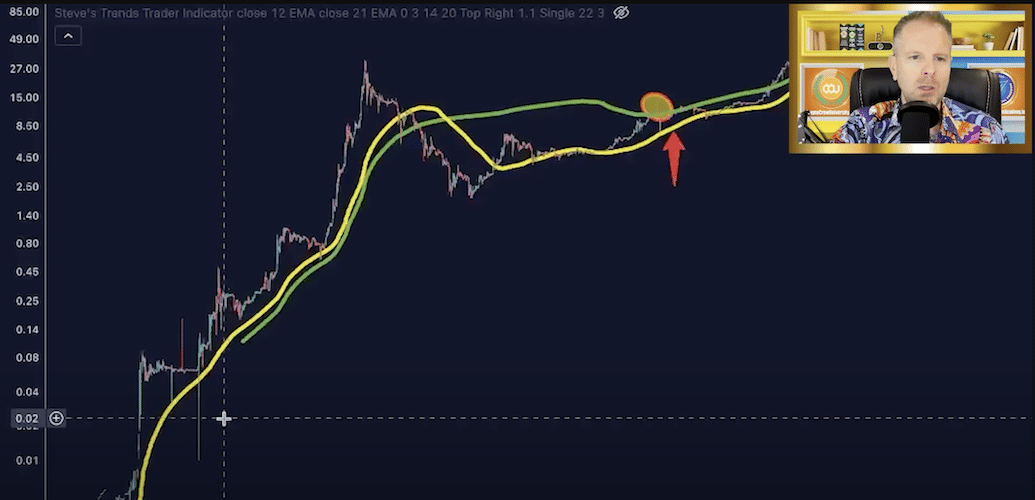
The Pi Cycle Top Indicator involves two key moving averages: the 350-day and the 111-day, represented in green and yellow respectively. Historically, the crossing of the 350-day moving average by the 111-day moving average (yellow line crossing above the green line) has signaled the market cycle’s peak. This pattern was evident in several previous Bitcoin cycles, including significant years like 2017 and prior cycles.
For instance, in 2021, the yellow line crossed the green line right at the market cycle top, mirroring the movements observed in 2017 and earlier cycles. This consistency across different cycles provides a compelling narrative about the indicator’s reliability.
Recent Observations and Market Implications
As of the latest observations, there is a noticeable approach towards another crossing of these two moving averages. The indicator shows that when Bitcoin’s price action moves above the green line, as observed for the first time since March 2021, it typically follows certain repetitive movements both before and after this crossing.
Historically, the appearance of red circles on the indicator, such as those seen in June 2019 and August 2012, has been indicative of significant market movements. These red circles often occur around the market cycle top, followed by a considerable price drop across both moving averages. However, a rally usually ensues, leading to a new all-time high after several hundred days.
Analyzing the Pattern Structure
The Pi Cycle Indicator not only focuses on the crossover but also examines the gap between the moving averages. The structural pattern of these gaps—widening and narrowing—plays a crucial role in predicting future price movements. A key pattern observed is the alternating wide and narrow gaps between the moving averages, which tends to repeat before reaching a new all-time high.
For example, the cycle typically starts with a wide gap (fat part), narrows down, widens again, and then narrows before peaking (all-time high). This pattern suggests a systematic and repeating structure in Bitcoin’s market cycles, potentially allowing investors to anticipate future movements.
Current Market Status and Future Predictions
Currently, Bitcoin is in a phase where the moving averages are narrowing, a sign that we might be deep into the bull run. This narrowing phase has historically correlated with significant rallies and market tops. The percentage difference between the green and yellow lines also provides insights into the market’s maturity in its current cycle. A less than 30% gap between these lines indicates a nearing cycle peak, reflecting the previous cycles’ structures.
However, the rate at which these gaps close can indicate the timing of the market peak. A slower, more methodical narrowing suggests a longer duration until the peak, whereas a rapid closure of the gap could indicate a quicker approach to the market cycle top.
Concluding Thoughts
The Pi Cycle Top Indicator continues to be a tool of high interest for both seasoned and novice Bitcoin traders. Its historical accuracy and the detailed analysis of the patterns provide a roadmap of sorts for understanding Bitcoin’s potential price movements. As the current cycle progresses, the market participants will closely watch these indicators to gauge the optimal moments for investment decisions.
In summary, while the indicator suggests an impending market peak, the exact timing and nature of this peak will depend on several nuanced factors, including the rate of narrowing between the moving averages and the overall market structure. As always, while the Pi Cycle Top Indicator provides valuable insights, market participants should combine this with other analyses and maintain a cautious approach to trading and investment in the volatile cryptocurrency market.

The Rise of Slothana: A New Meme Coin Sensation on Solana
In the realm of cryptocurrency, Slothana, a new meme coin on the Solana blockchain, has quickly become the talk of the town by securing a whopping $15 million in a month-long presale. This remarkable achievement reflects the growing interest in Slothana’s $SLOTH coin, which is touted as being 420-friendly and has captured the attention of many in the crypto community.
Currently, the initial coin offering (ICO) for Slothana is still in progress, with an official countdown on their website indicating that there are less than three days remaining until the presale concludes on April 29. Interest in the project has surged significantly, with funds escalating from $10 million at the start of last week to several million more by the start of this week.
This influx of investments coincides with key dates in the crypto calendar; notably, Bitcoin’s fourth quadrennial halving and the international stoner day both occurred on April 20. These events have set the stage for what could be an explosive period for buying activity in the crypto market, particularly as Slothana gears up to announce the date for its $SLOTH airdrop and future market listing.
Cryptocurrency analysts are optimistic about the potential market dynamics post-Bitcoin halving, drawing on historical trends where past halvings have led to significant bull runs. The recent halving has cut the Bitcoin mining reward from 6.25 BTC per block to just 3.125, effectively doubling the effort required by miners to earn the same reward. This reduction has introduced a supply shock in a year already notable for its crypto enthusiasm, further emphasized by the US Securities and Exchange Commission’s approval of 11 Bitcoin ETFs in January. These ETFs allow investors to buy and hold Bitcoin through regulated channels, contributing to Bitcoin’s recent peak price of $73,737.94.
🚀 Hold onto your branches, Slothana faithful! 🌿 We're gearing up to drop some major news: the official launch date is on the horizon! ⏰ Get ready to mark your calendars and set your alarms, because a countdown timer will soon grace our site. Let the hype for the Slothana…
— Slothana (@SlothanaCoin) April 14, 2024
The broader impact of Bitcoin’s movements is palpable across the cryptocurrency market, with major coins typically mirroring Bitcoin’s price fluctuations. The strong performance of Bitcoin in early 2023 catalyzed substantial gains across numerous crypto projects, particularly in late February and early March.
On the Solana network, the surge in new meme coins like Slerf, DogWifHat, and Bonk has outstripped their Ethereum counterparts on several occasions, boosting Slothana’s presale momentum. Yet, despite these successes, recent network outages have temporarily dented Solana’s price, though a recent mainnet beta update deployed by developers aims to tackle these congestion issues and pave the way for a robust recovery.
For those looking to invest in Slothana, time is of the essence. There are merely three days left to participate in the Visit Slothana Here through the official site.
Related News
- Security Breach Hits El Salvador’s Official Bitcoin Wallet: Chivo Under Threat
- Solana Stoner Meme Coin Project Slothana Secures $15 million In ICO, Only Six Days Left To Buy
- Bitcoin Halving and Political Events: Is This Time Different?
- Binance To Launch Crypto Exchange In Thailand With Thai Billionaire Sarath Ratanavadi
Best Wallet - Diversify Your Crypto Portfolio

- Easy to Use, Feature-Driven Crypto Wallet
- Get Early Access to Upcoming Token ICOs
- Multi-Chain, Multi-Wallet, Non-Custodial
- Now On App Store, Google Play
- Stake To Earn Native Token $BEST
- 250,000+ Monthly Active Users
Join Our Telegram channel to stay up to date on breaking news coverage