Join Our Telegram channel to stay up to date on breaking news coverage
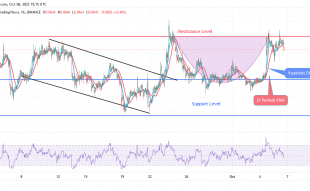
Tamadoge took its support from $0.120000 and moved continuously on the bullish trend till the price reached around $0.170000 price level. Before the market took up the bullish trend, it started a long down-trending market movement after sellers hijacked what should have resulted in a bullish trend (that is the bullish candle of the 17th hour of yesterday’s market). Sellers gained upper hand after that 17th-hour bullish market. As a result of this, the market performed in favour of sellers till the 5th hour of today. Now, the buyers are having the upper hand.
Tamadoge Market Price Statistic:
- TAMA/USD price now: $0.1829
- TAMA/USD market cap: $175,740,485
- TAMA/USD circulating supply:1.01Billion
- TAMA/USD total supply: 1,049,733,333
- TAMA/USD coin market ranking: #2651
Key Levels
- Resistance: $0.1850, $0.1900, $0.2000
- Support: $0.1284, $0.1200, $0.1134
Tamadoge Market Price Analysis: The Indicators’ Point of View
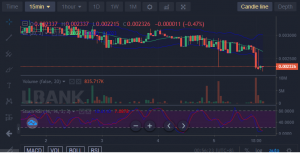
According to the indicators, the market price has reached the overbought zone and consequently, it is retracing a lower price level. The price actions moved out of the Bollinger band indicator in the 11th hour of today’s market. However, to show the possibility that the trend may still perform in favour of the buyers, the two bands of the Bollinger are widening up to give room for more market performance.
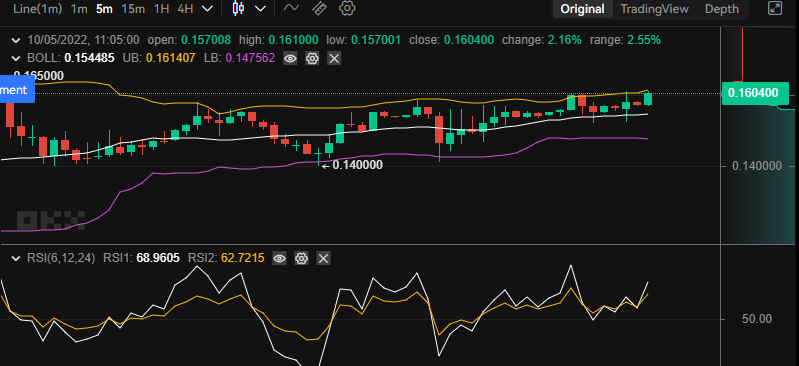
Tamadoge: TAMA/USD 5-Minute Chart Outlook
The TAMA market has gotten to the oversold region in the indicators of this timeframe. And the indicator lines are now making efforts to retrace an upper level. This market outlook allows us to see how volatile the market is. This is what widens the band. The RSI line now measures a strength near the threshold of the overbought.
Join Our Telegram channel to stay up to date on breaking news coverage