Join Our Telegram channel to stay up to date on breaking news coverage
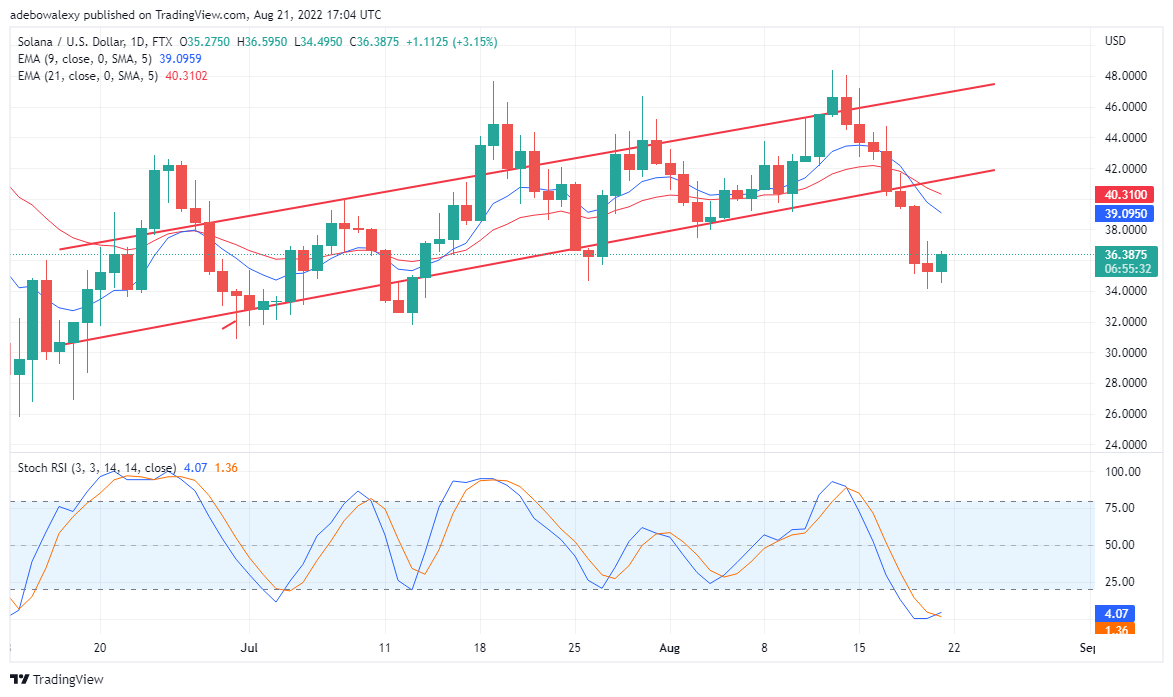
Solana has come under the activities of strong downward forces after correcting downwards from higher resistance. For some time now SOL/USD has been trading in an upward-slopping price channel. However, things took a new turn around the 14th of this month, when price action hit a higher resistance of near
SOL’s Forecast Statistics Data:
SOL’s current price: is $46.08
SOL’s market cap: $12.71 billion
SOL’s systemic supply: 348.12 billion
SOL’s overall supply: 511.62 million
SOL’s Coinmarketcap ranking: #9
$47.00. Afterward, a sharp downward correction has to be experienced in this market. We shall try to examine this market, to find out if there are signs of recovery. Also, we shall try to figure out the best approach that can be given to this type of market situation.
Key Price Levels:
Resistance levels: $36.9, $40.0, $43.0
Support levels: $35.0, $35.8, $39.5

Solana Downtrends Sharply, but Tamadoge Promises a Bullish Market
SOL/USD price activity has broken a long-term increasing support in a strong rebound off a resistance. However, the appearance of the latest bullish candle may be hinting at the fact that strong support has been found. Hence, we might have a correction from her to the upside. Additionally, the EMA curves appear to be in pursuit of the price candles as it appears moving steeply toward it.
Furthermore, the Stochastic Relative Strength Indicator has arrived at the oversold region. Also, we can observe that these lines have been able to cross each other in the oversold. However, The direction of this line afterward is yet unknown. But, with rising buying pressure the lines will move upwards. Consequently, Traders in this market can expect the value of this pair to rise to around $40 at the least.

Solana Value Forecast: Is SOL/BTC Price Correcting Already?
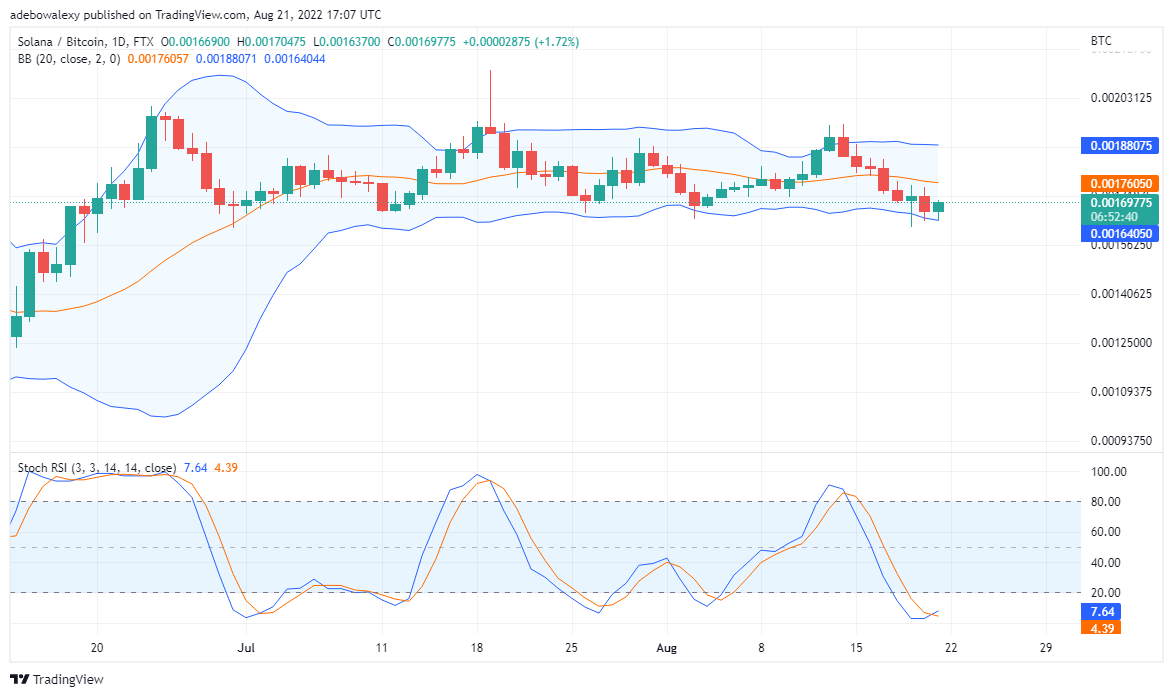
SOL/BTC daily trading chart activities stay somewhat the same as what we have on the SOL/USD chart. Here, the last candlestick appears to be correcting off the lower band of the Bollinger band. However, we can only anticipate here as things appear to be at the developing stage. The lower shadow of the last candlestick has touched on but hasn’t sufficiently pushed the lower band of the Bollinger.
Your capital is at risk
Also, the SRSI indicator curves has crossed each other at the oversold area. Going by this it’s safer for one to see if more bullishness will set into the market. Therefore traders thinking of placing a trade in a market such as this can place a buy stop near 0.00176050.
Tamadoge is also securing strategic listings on centralized and decentralized exchanges as part of its roadmap. The first listing has already been secured on LBank. LBank is a centralized exchange, and the Tamadoge team is optimistic that TAMA could be paired with ETH to support the project’s rapid growth as it faces improved liquidity.
Related
Join Our Telegram channel to stay up to date on breaking news coverage

