Join Our Telegram channel to stay up to date on breaking news coverage
Ripple Price Prediction – December 29
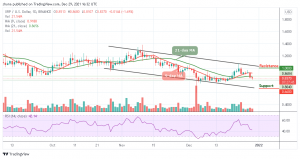
The Ripple price prediction shows that XRP is currently facing the south after touching the daily high of $0.86 level.
XRP/USD Market
Key Levels:
Resistance levels: $1.00, $1.05, $1.10
Support levels: $0.66, $0.61, $0.56
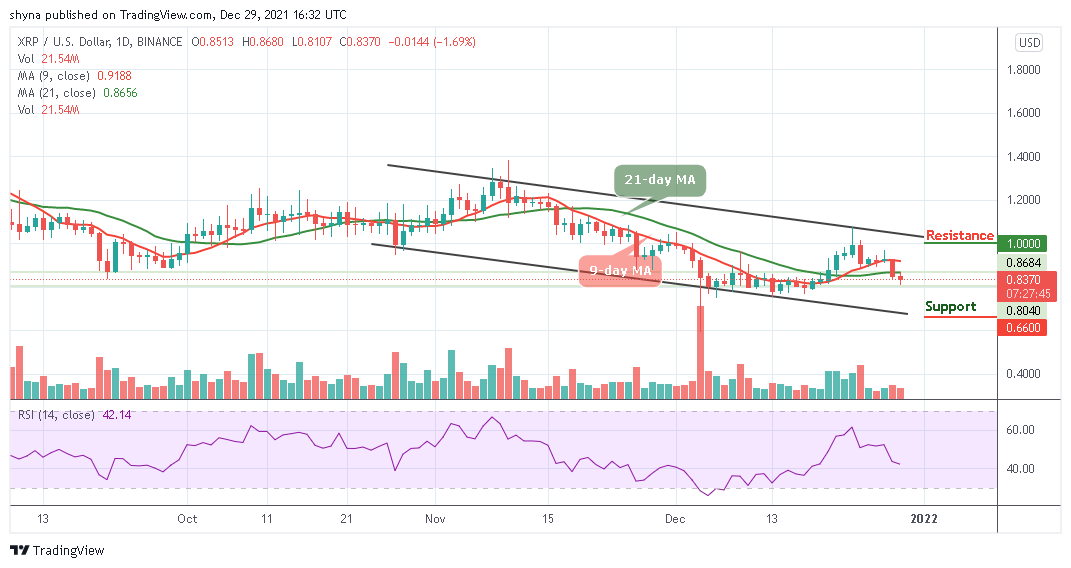
XRP/USD is currently falling below the 9-day and 21-day moving averages from the opening price of $0.85. At the time of writing, the bulls are having a hard time finding support as they move down towards the lower boundary of the channel. Therefore, traders can see that XRP/USD is gradually losing all the gains made few weeks ago but the bulls could attempt to see a bounce in the next positive movement.
Ripple Price Prediction: Ripple (XRP) May Head to the Downside
If the Ripple price drops below the $0.80 support level, the coin is likely to locate the $0.70 support, which is the close support level for the bears. A bearish continuation could then bring the market to the critical supports below the lower boundary of the channel at $0.66, $0.61, and $0.56 respectively.
On the contrary, should the bulls resume and take over the market, the price may break above the 9-day and 21-day moving averages to hit the potential resistance levels at $1.00, $1.05, and $1.10. Meanwhile, the technical indicator Relative Strength Index (14) may move sideways if the signal line failed to cross below 40-level. Therefore, if the price oscillates downward, the Ripple price may begin to fall.
When compares with Bitcoin, the Ripple price is sliding below the 9-day and 21-day moving averages. Therefore, the price is set to test 1700 SAT if the selling pressure increases. Meanwhile, the bearish scenario may remain dominant within the channel if the bears keep the coin at the downside.
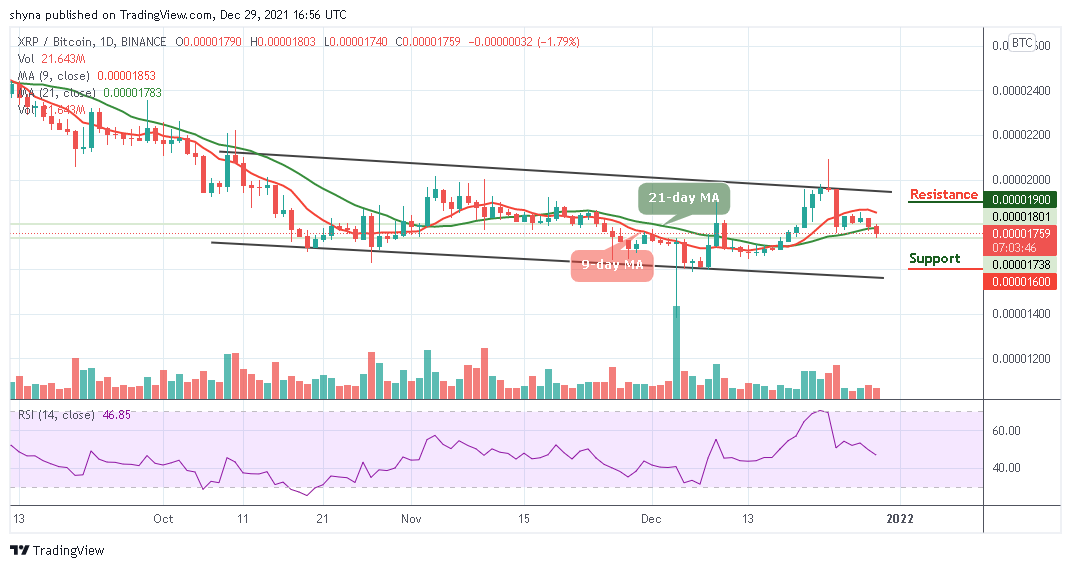
However, if the sellers occupy their positions, the Ripple price may drop to the support level of 1600 SAT and below. Presently, the technical indicator Relative Strength Index (14) is moving to cross below 45-level, this could keep the coin within the negative side. Meanwhile, any bullish movement above the 9-day and 21-day moving averages may likely push the Ripple price to the higher levels, which could touch the resistance level at 1900 SAT and above.
Join Our Telegram channel to stay up to date on breaking news coverage