Join Our Telegram channel to stay up to date on breaking news coverage
XRP Price Prediction – September 29
XRP coin slipped tremendously with the entire market crashing down. The downtrend seems to stick around for a while.
XRP/USD Market
Key Levels:
Resistance levels: $0.28, $0.30, $0.32
Support levels: $0.20, $0.18, $0.16
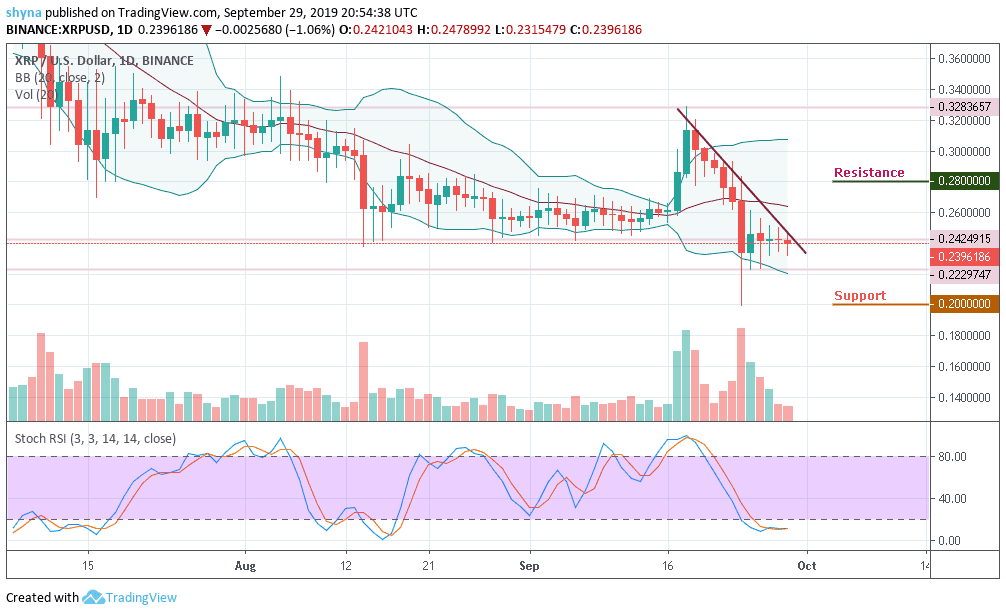
XRP/USD has been moving in sideways for some time, so the traders can expect the trend to begin to fall from now if the price action breaks down and move to the lower part of the Bollinger Bands. Meanwhile, a break in the channel could give the market enough strength to dig dip, but the rise might lead the market to a bullish scenario.
Looking at the daily chart, XRP/USD reaches a narrow-angle that has formed in recent months. After hitting a monthly high of $0.328, the Ripple price hit a new low of $0.22, which is currently strengthening the movement of the price. Although facing a difficult level at $0.23, the market may likely reach the resistance level of $0.28, $0.30 and $0.32 respectively.
For the moment, traders are not yet resolved to buy. If the buyers become weak now, we can expect the market to push the price to the support zone of $0.22 and $0.21 levels. The $0.20, $0.18 and $0.16 could also help in supporting the market if the nearest support level failed to contain the next bearish rally. At the same time, the stochastic RSI fell sharply in the oversold zone as a result of the recent massive sell-offs in the market.
Moreover, when comparing it with BTC; Ripple (XRP) has demonstrated some positive sign across the market. The trend is still perpetually looking bullish on the long-term, exchanging hands at 2978 SAT while it moves within the ascending channel.
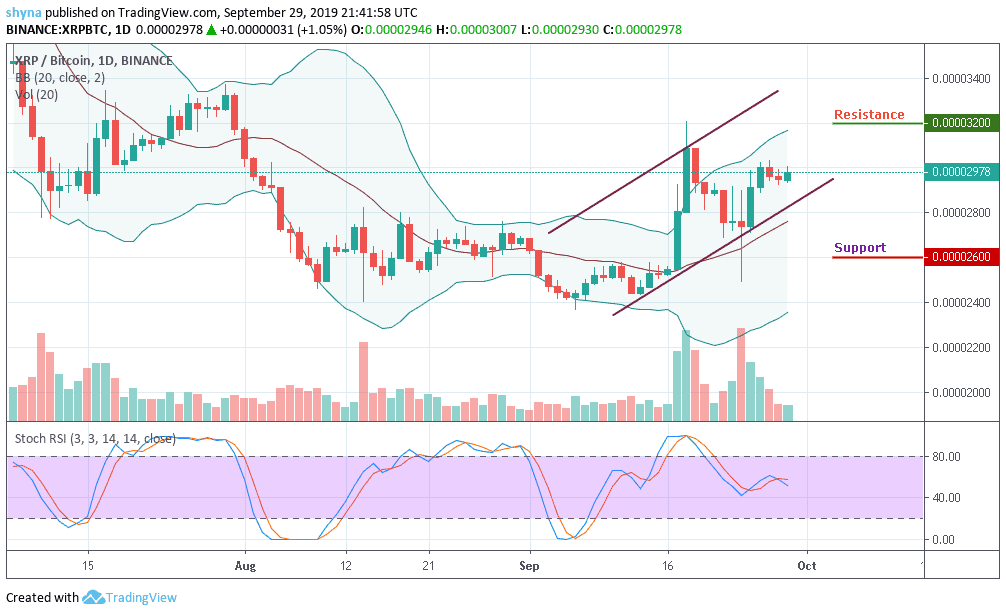
Meanwhile, the coin witnessed a bearish drive against BTC a few days ago and the resistance levels to look for are 3200 SAT and 3400 SAT while the closest support to keep an eye on is the 2600 SAT, 2400 SAT, and potentially 2200 SAT. The stochastic RSI is moving around level 60, which indicates that the market could move in sideways for some time.
Please note: Insidebitcoins.com is not a financial advisor. Do your research before investing your funds in any financial asset or presented product or event. We are not responsible for your investing results.
Join Our Telegram channel to stay up to date on breaking news coverage