Join Our Telegram channel to stay up to date on breaking news coverage
XRP Price Prediction – October 7
In the last 24 hours, Ripple (XRP) has gained more than 7.54% and the next resistance level may be at $0.29.
XRP/USD Market
Key Levels:
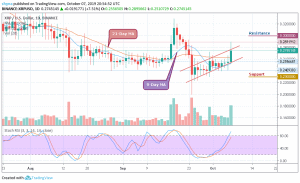
Resistance levels: $0.30, $0.32, $0.34
Support levels: $0.23, $0.21, $0.19

Ripple’s XRP jumped from $0.255 to the area above $0.270 in a matter of hours and touched an intraday high at $0.289. While the coin has retreated to $0.276 as at the time of writing, the pair retains bullish momentum. In the short term, XRP/USD has gained more than 7% in the last 24 hours and 7.5% since the beginning of the day. Currently, it is the best-performing coin out of the top 10.
Meanwhile, due to a strong upside movement of the coin, Ripple’s XRP broke free from the recent range and tested the highest level since last month September 23, 2019. The middle boundary of the channel at $0.260 now serves as strong support for the coin. if it is broken, the sell-off may be extended towards $0.240.
Currently, the price of the coin is changing hands at $0.027 level and the bulls are still gathering momentum. If the price moves below moving averages of 9-day and 21-day to break down the lower boundary of the channel, the price could be pushed to the support level of $0.23, $0.21 and $0.19 levels.
Moreover, the stochastic RSI is entering the overbought condition, which indicates that the bullish trend may come to play. If the bulls can put more effort to push the XRP/USD higher, further resistance may likely be found at $0.30, $0.32 and $0.34 levels before the market is free to make another attempt at $0.36 level.
When comparing with BTC, Ripple (XRP) is still demonstrating some positive signs across the market. The trend is perpetually looking bullish on the long-term and moving within the ascending channel. It is currently changing hands at 3346 SAT after witnessing some bearish moment last month.
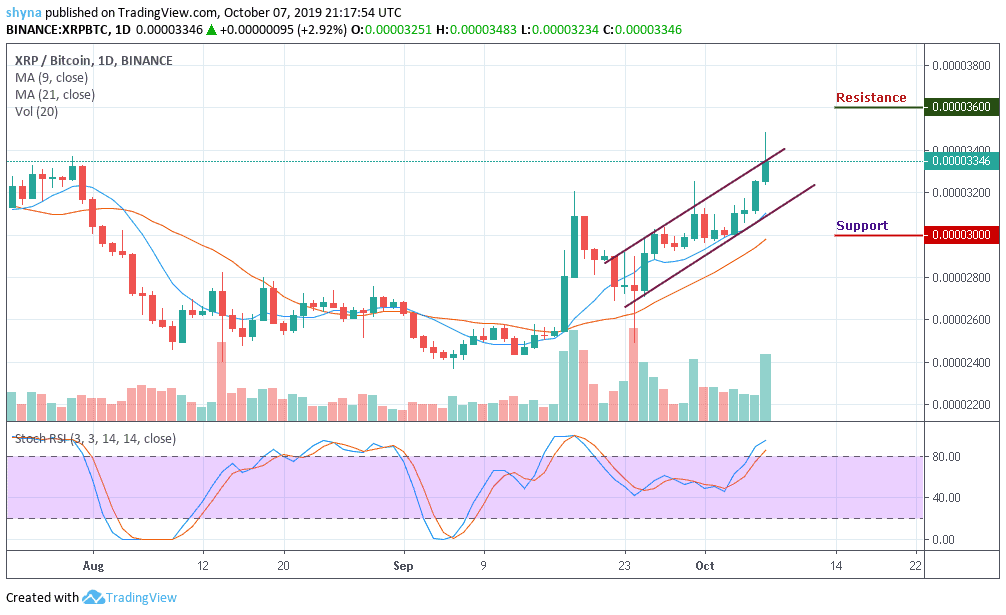
The resistance levels to look for are 3600 SAT and 3800 SAT while the closest support levels to keep an eye on are 3000 SAT, 2800 SAT, and potentially 2600 SAT. The stochastic RSI is moving into the overbought territory, which indicates more bullish signals for some time.
Please note: Insidebitcoins.com is not a financial advisor. Do your research before investing your funds in any financial asset or presented product or event. We are not responsible for your investing results.
Join Our Telegram channel to stay up to date on breaking news coverage