Join Our Telegram channel to stay up to date on breaking news coverage
XRP Price Prediction – December 29
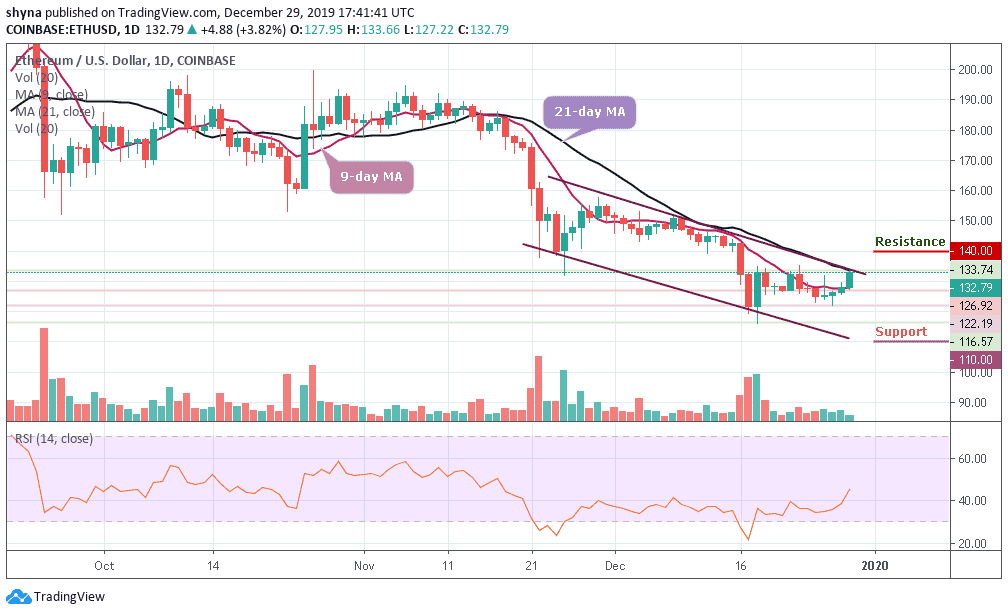
XRP/USD is struggling to gain bullish momentum and it might continue to struggle near $0.189 and $0.195.
XRP/USD Market
Key Levels:
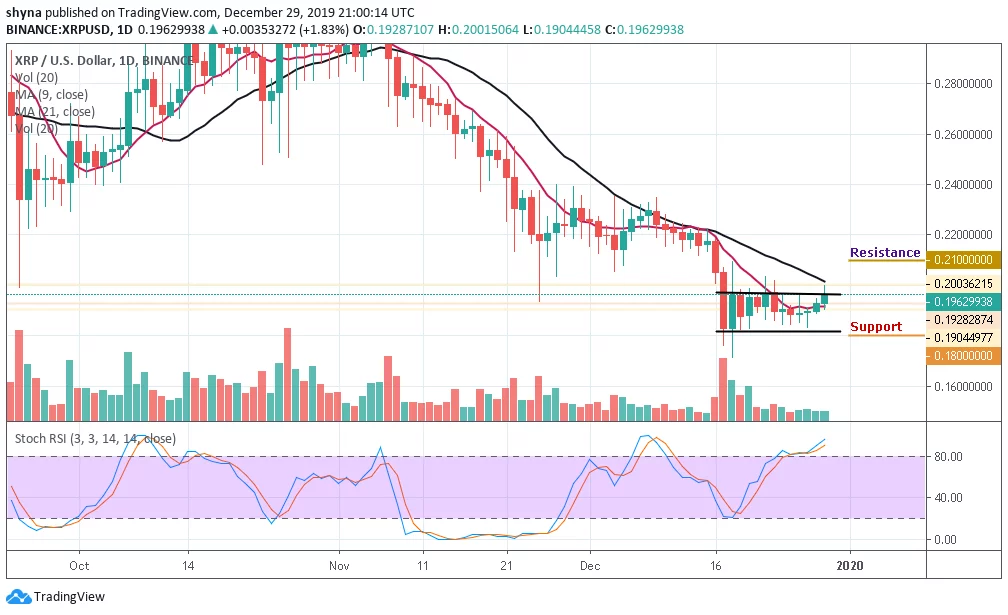
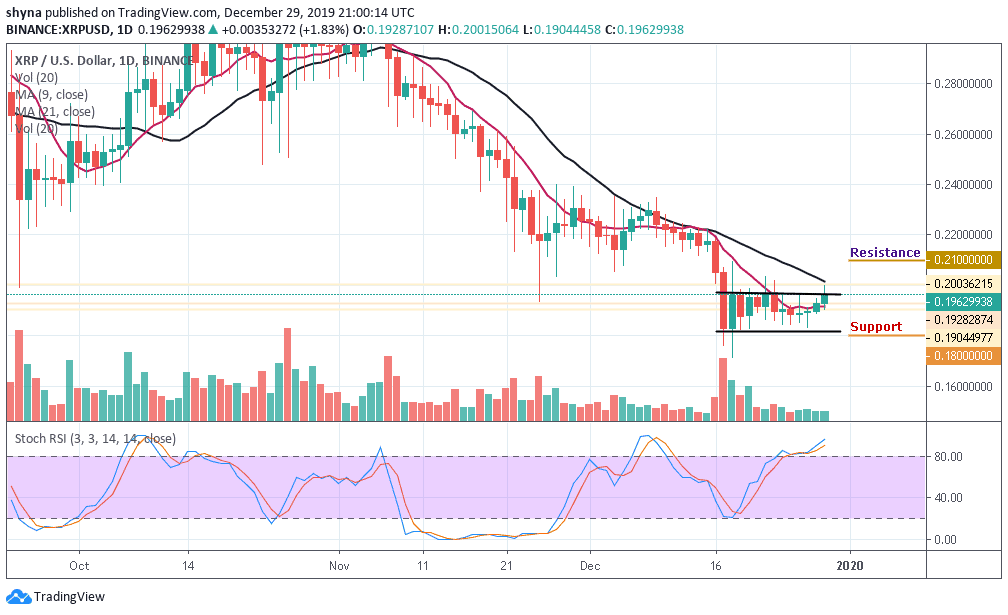
Supply levels: $0.210, $0.220, $0.230
Demand levels: $0.180, $0.170, $0.160
The price of XRP/USD has seen a small increase of around 1.83% as the market opens today and it currently trades at $0.196 above the 9-day MA. The cryptocurrency still has hard times moving above the $0.200 level as the previous attempts so far have failed. Despite this, the coin still remains the third-largest cryptocurrency with a market cap of $8.5 billion.
Moreover, in the last couple of days, the Ripple price has remained relatively strong to the extent that the gains towards the vital $0.200 have been acutely steady. At the same time, the movement to a downward trend has been cut short. In the early hours of today, the Ripple price has gone down from $0.192 to $0.190. The bulls had now taken the price up to $0.196.
Furthermore, a significant cross above the key resistance could sustain the bulls to $0.205 high. Meanwhile, Ripple is currently on an upward trend and still maintaining it. If XRP manages to surge above $0.205, it may see the resistance levels at $0.210, $0.220 and $0.230, though a further drop may take the price to the support levels $0.180, $0.170 and $0.160. The Stochastic RSI indicator is showing some bullish signals by moving within the overbought zone.
Against Bitcoin, the pair is consolidating within the channel and now moving above the 9-day moving average. Meanwhile, the buyers are making effort to push the coin to the north of which the bullish continuation may likely take it to the resistance levels of 2800 SAT and 2900 SAT respectively.
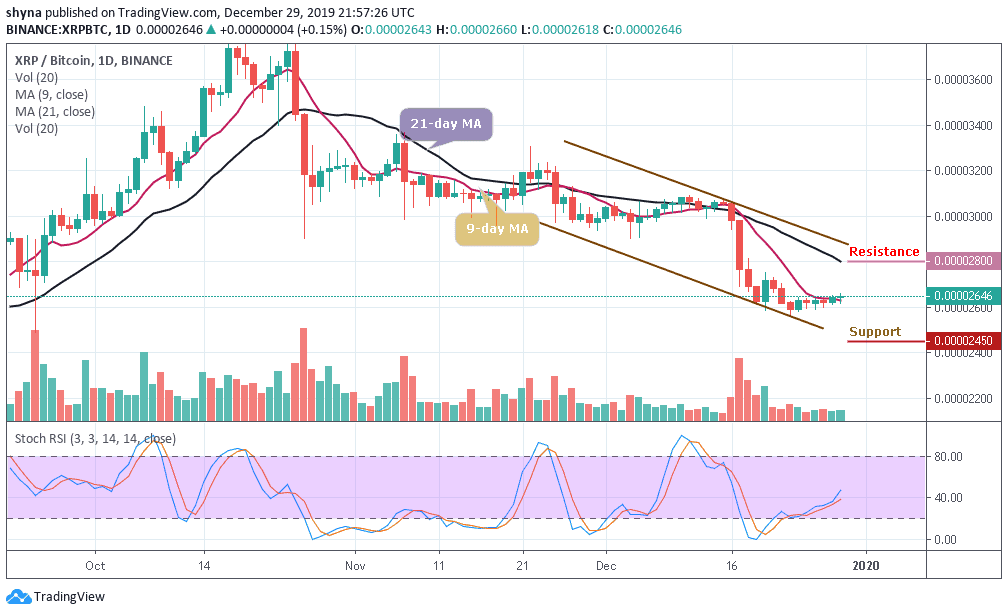
Conversely, if the bulls failed to hold the price, then it could fall towards the lower boundary of the channel and the nearest support levels to be met are 2450 SAT and 2350 SAT. Moreover, the stochastic RSI moves above 40-level, which indicates an upward movement.
Please note: Insidebitcoins.com is not a financial advisor. Do your research before investing your funds in any financial asset or presented product or event. We are not responsible for your investing results.
Join Our Telegram channel to stay up to date on breaking news coverage