Join Our Telegram channel to stay up to date on breaking news coverage
There are indications that price action in the DOT/USD market may soon rebound upwards. At the same time, contrary to this opinion there are signs of a downtrend continuation in this market as well. To be more precise, one can assume that traders in this market are in a dicey situation.
DOT Analysis Statistics Data:
Polkadot’s value now: $6.06
DOT’s market cap: $7.96 billion
Polkadot’s moving supply: 132.67 billion
Total supply of DOT: 132.67 billion
Polkadot’s Coinmarketcap ranking: #10
As a result, this calls for more closer checks to be carried out, to correctly anticipate and utilize any resulting market moves. Also, this price analysis will be extended to the DOT/BTC market as well.
Important Value Levels:
Top Levels: $6.28, $6.40, $6.60
Bottom Levels: $6.06, $5.90, $5.70

Polkadot Price Prediction Today October 14, 2022: DOT/USD Seems to Have Reached a Rock Bottom
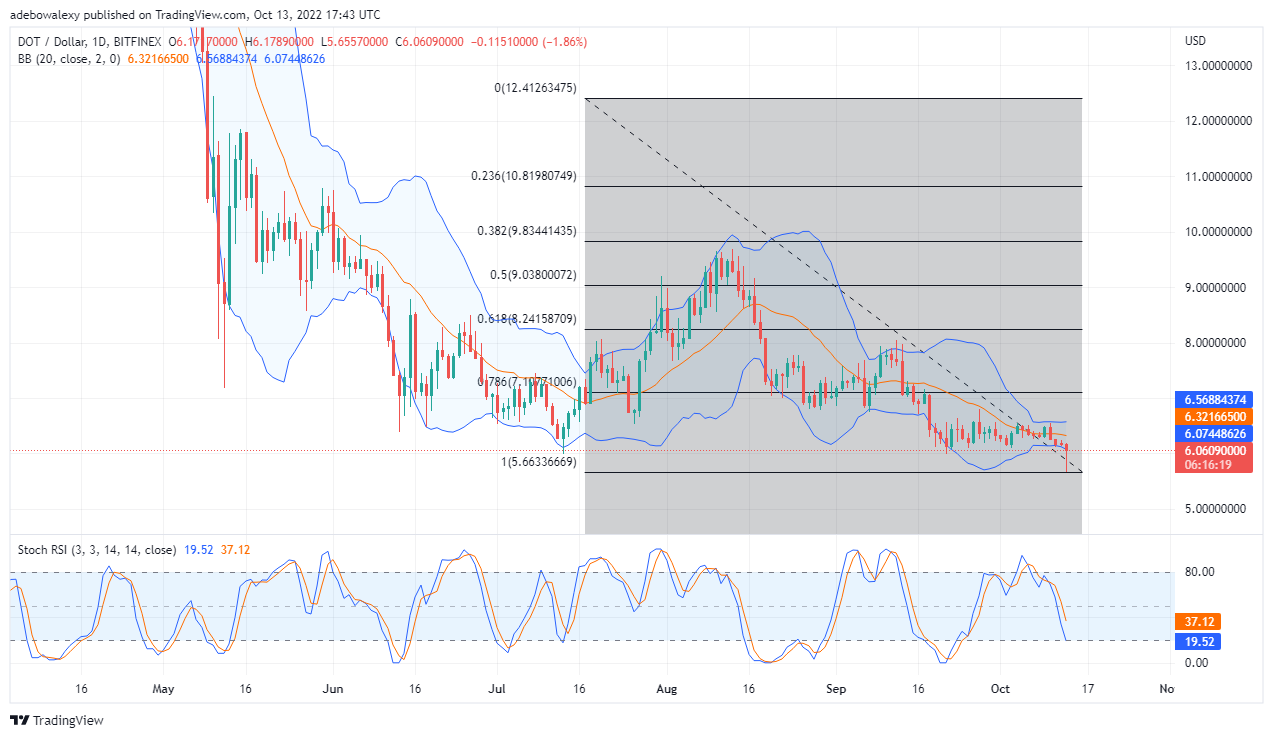
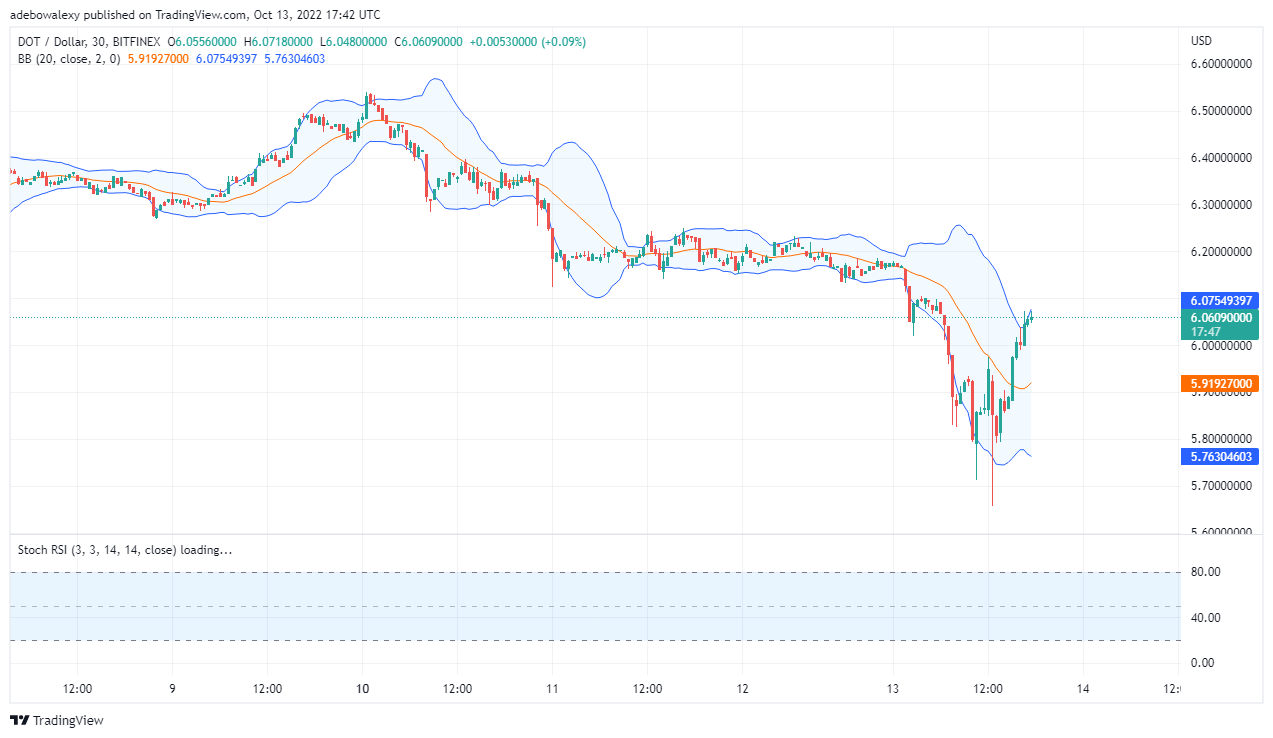
DOT/USD may be preparing to move upwards from the look of things. However, this perception isn’t in the absence of some signs of possible price fall in this ongoing session. The last red candlestick here is sitting on the Lower limit of the used Bollinger indicator. It is worth noting that once either limit of this Indicator is pushed by price candlesticks there could be a rebound in the opposite direction. Nevertheless, the magnitude of the correction may not be readily determined. On the other hand, the Stochastic RSI curves are running towards the oversold region. However, should a considerable number of buy orders be triggered in this session a bullish crossover may be initiated, as the price bounces off to the upside? Traders can place a pending long order at the $6.20 price mark, to catch the bounce early enough.
Polkadot Price Prediction Today October 14, 2022: DOT/BTC May Bounce to the Upside
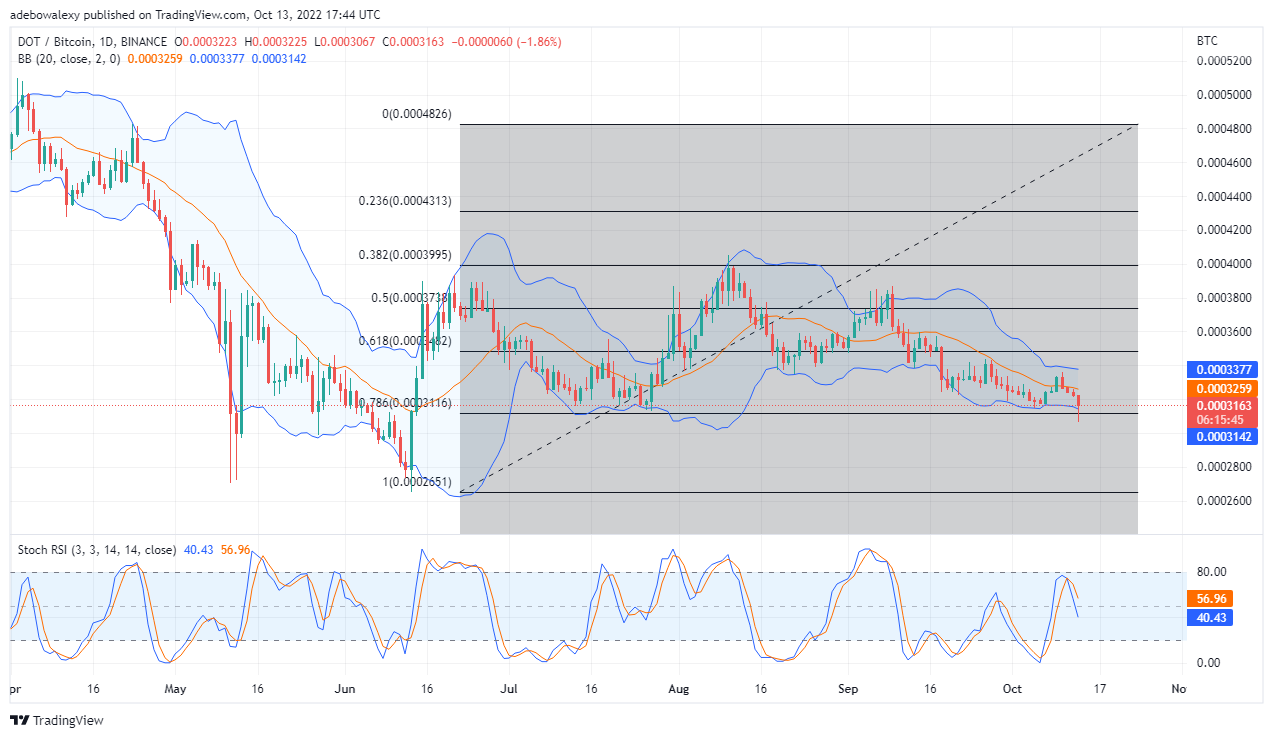
Price movement in the DOT/BTC looks more like a replica of movement in the DOT/BTC, the only difference is lies in the tested Fibonacci level. Here likewise, price action has tested lower support of 0.0003116, and this aligns with the Fib level of 78.60. Also, the RSI is at 57% and 40% levels, by implication the lagging line is still above the oversold level and the leading line has reached below it.
Your capital is at risk.
In this market, traders can only lay a price trap above the current value level of 0.0003163. The reason for this kind of approach is mainly because a rebound can be expected once the lower limit of the Bollinger is pushed, as a significant uptrend can result from here. The price in this market can reach 0.0003482.
Join Our Telegram channel to stay up to date on breaking news coverage


