Join Our Telegram channel to stay up to date on breaking news coverage
Polkadot Price Prediction – October 26
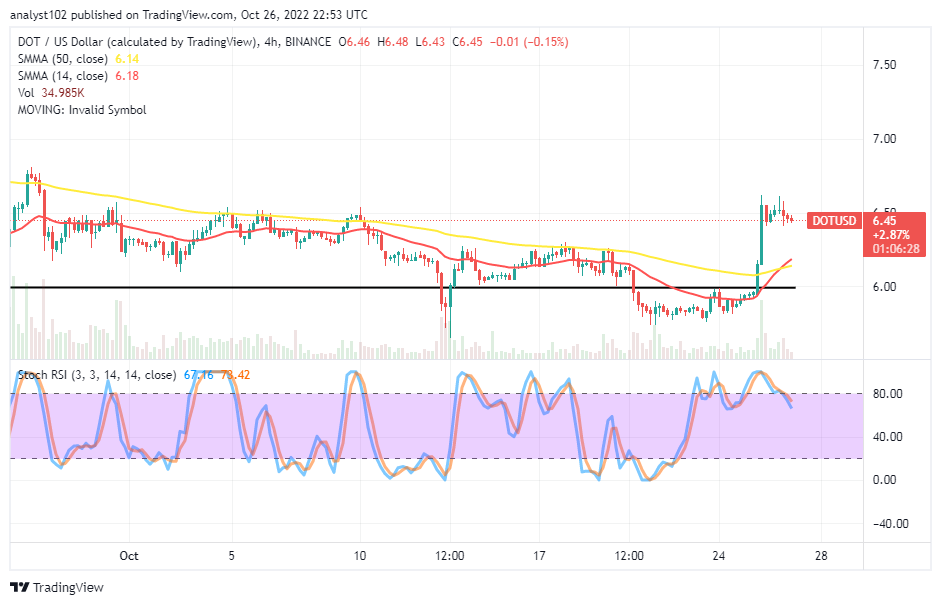
Selling activities appeared to have been completed around the $6 trading line as the DOT springs northward from the value line. The last several hours have witnessed the trading session between the high and the low of $6.61 and $6.41 value lines, keeping a minute positive percentage of 0.78.
DOT/USD Market
Key Levels:
Resistance levels: $8, $9, $10
Support levels: $6, $5, $4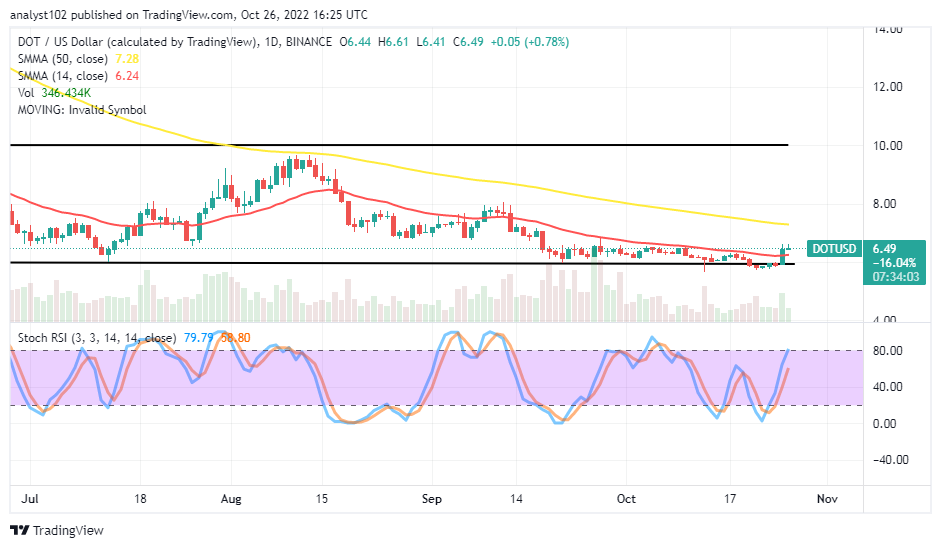 DOT/USD – Daily Chart
The daily chart reveals DOT springs at the $6 trading level at a lower spot. The 14-day SMA trading indicator is at a $6.24 value point underneath the $7.28 line of the 50-day SMA indicator. The Stochastic Oscillators have swerved northbound to the range points of 58.80 and 79.79. Yet, they are pointing toward the upside to attest that some upward motions are relatively ongoing.
Will there be more ups in the LTC/USD market above its current trading point?
As of the time of writing, the crypto market possesses slight bullish momentum against the possibility of having a smooth downward-trending motion as DOT springs around the $6 against the US Dollar. A large part of the bullish candlestick that occurred yesterday featured a light top shadow. Like wisely, today’s trading candlestick is on the verge of displaying a continuation of the same pattern at a higher end around the $7 level. Therefore buyers are to be cautious of executing new longing orders.
On the downside of the technical analysis, the present trading situation still indicates that sellers may lookout for several rejections to occur closely or nearly below the 50-day SMA trend line before taking a step to launch back a shorting order. A 1-hour chart, complementing a 4-hour chart, will give a better mental of observing an early sell signal when variant candlesticks emerge on them to indicate retraces from a high-resistance trading zone afterward.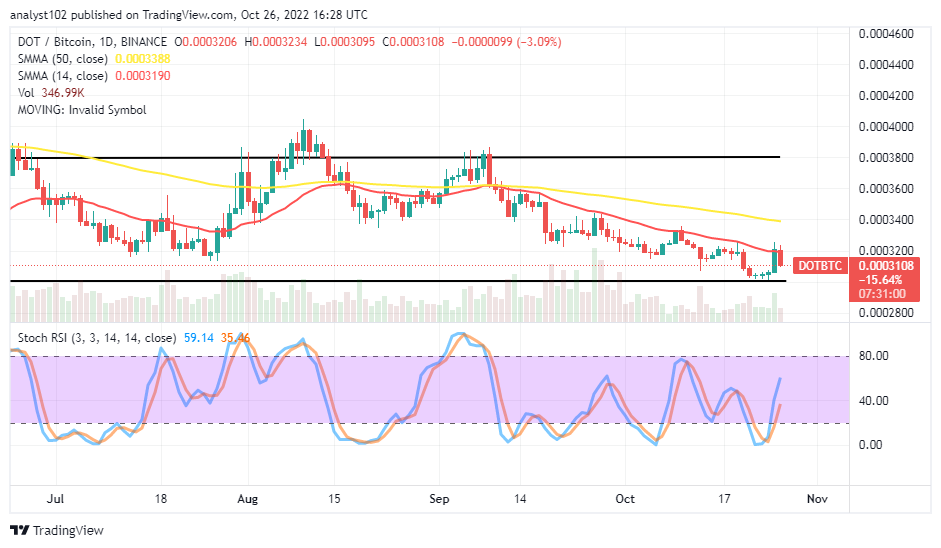
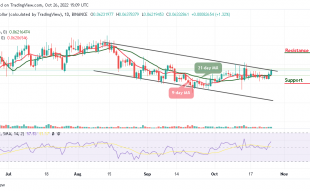
DOT/BTC Price Analysis
DOT springs from a zone where the lower horizontal line drew below the SMA trend lines. The 14-day SMA indicator is underneath the 50-day SMA indicator. The Stochastic Oscillators have crossed from the oversold region to 35.46 and 59.14 range values. A bearish candlestick is in the making to dowse the possibility of the base crypto’s trending ability against its counter-trading crypto despite the spike.
The Dash 2 Trade presale is off to an excellent start, having already raised more than $2 million in just a few days. The price initially was $0.0476, and it is now $0.05. The price will again increase to $0.0513 at the third presale phase.
Related
Join Our Telegram channel to stay up to date on breaking news coverage